It’s a good idea to make yourself familiar with the following topics before commencing this lesson:
This lesson will cover the basic concepts of Cybus Services and how they relate to the Connectware. We will focus on how applications deployed as services can take advantage of the data broker for accessing output from data sources on the Connectware, the management cluster for gaining access to that output and the single entry point for providing new interfaces where users can take advantage of processed data.
While the Connectware gives interfaces for individually performing all actions (like managing users, setting permissions, starting containerized applications, etc.) the idea of services is to bundle all this activities into a single point of configuration and execution. This means that when a service is enabled it will perform a set of operations on the Connectware and when disabled these operations will be removed. Below you will find some examples of possible service use cases.
Think of a simple machine that produces a metal part. Whether a metal part is being made at any one point of time may not be the important but the average amount being made over a given time period may be useful for knowing if the machine is underperforming. We can accomplish this by connecting the machine to the Connectware, and then deploying a service along side that takes the raw data from the data broker, calculates the average over a given period of time, then uploads the result to the data broker for some other application to consume. This type of application is classified as a preprocessor as it allows us to perform some operation on the data before it is consumed elsewhere.
Think of a machine that drills holes in a piece of material. When the machine is drilling we want to set a lamp to be green, when the machine is between drilling we want to set a lamp to be yellow and when the machine is powered off we want the light to be red. We can connect both the machine and the lamp to the Connectware, then read the status of the machine from the data broker into a service. This service can perform a check on the status and then write out to the data broker on a topic that controls the light to change colors. This type of application is classified as a Device controller as we are using input data to write to a device connected to the Connectware.
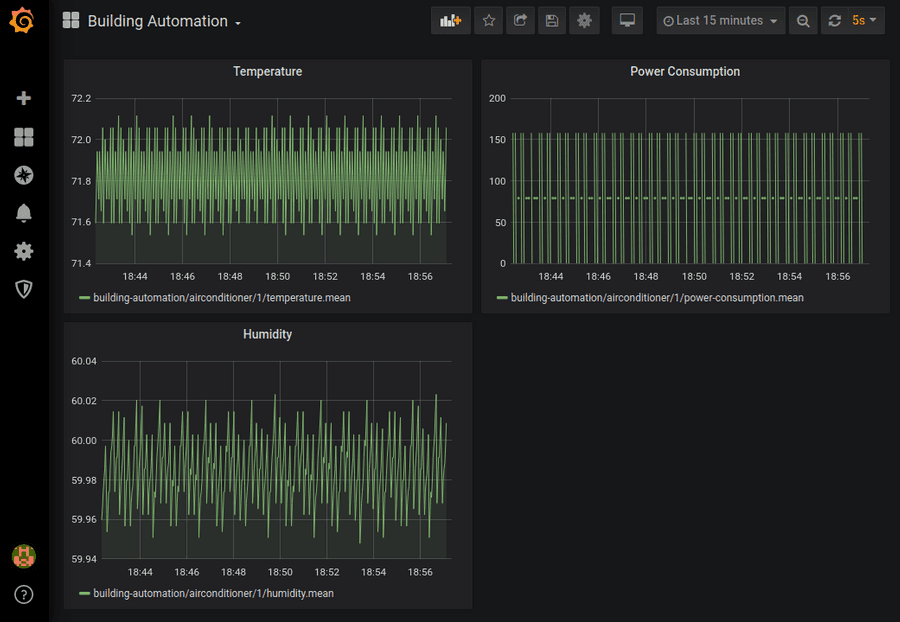
Think of an assembly line that outputs new products ready to be shipped. We can connect the sensors of the assembly to the Connectware and build a service that provides a web dashboard which outputs different graphs for the average output, speed, temperature and power used throughout the day. Administrators can then sign in to the Connectware and view this dashboard to see the status of the assembly line. This type of application is classified as a Data Visualization as it takes data from the Connectware and provides visualizations to allow easier consumption of important data.
These are only a few examples of the types of services that Cybus Connectware can deploy. As you will see below the Connectware is built on top of Docker, so as long as your application can be containerized it can be deployed on the Connectware.
Services are installed using a commissioning file. Within this text-based YAML file, all so-called resources like connections, endpoints, users, permissions and containerized applications a service uses are listed. Below you will find an example service commissioning file that deploys a Grafana instance which we will configure to show data provided by an OPC UA Server and stored in an InfluxDB. If any section of the service commissioning file needs clarification please feel free to visit the Connectware Docs.
The first two sections of the service commissioning file give more general information. In the section description you can give a short description of the service which will also be displayed in the service’s details view on the Connectware Admin User Interface (Admin UI). The section metadata contains the meta information for the service that is being installed. Here we set a name of the service, version number, provide an icon for the thumbnail of the service, specify a provider and a related homepage.
#------------------------------------------------------------------------------
# CYBUS SERVICE COMMISSIONING
#------------------------------------------------------------------------------

description: |
  Service Commissioning File Example
  Cybus Learn - Service Basics
  https://learn.cybus.io/lessons/service-basics/

metadata:
  name: Service Basics Example
  version: 0.0.3
  icon: https://www.cybus.io/wp-content/uploads/2019/03/Cybus-logo-Claim-lang.svg
  provider: Cybus GmbH
  homepage: https://www.cybus.io
Code-Sprache: YAML (yaml)To make a service configurable, we can specify parameters. Parameters are like referable variables whose values are defined by the user every time a service is to be installed or reconfigured. When applying a commissioning file in the Connectware, the user is asked to enter custom values for the parameters or to confirm the default values.
In this example we use parameters to make the OPC UA server address configurable for the case it would move to another location.
#------------------------------------------------------------------------------
# Parameters
#------------------------------------------------------------------------------
parameters:

  opcuaHost:
    type: string
    description: OPC UA Host Address
    default: opcuaserver.com

  opcuaPort:
    type: integer
    description: OPC UA Host Port
    default: 48010
Code-Sprache: YAML (yaml)In the Resources section we declare every resource that is needed for our service. All resources like connections, endpoints, users, permissions and containerized applications are configured here. The first resource we define for our service is the connection to the OPC UA server.
#------------------------------------------------------------------------------
# Resources
#------------------------------------------------------------------------------

resources:
Code-Sprache: YAML (yaml)In this lesson we will collect some simulated data from a public OPC UA server. We define a connection and endpoint resources for this. For the connection we just need to specify the protocol as well as the server’s host address and port, which we define by referencing the previously declared parameters. For the endpoints we define three resources, each subscribing to a variable node on the OPC UA server identified through the nodeId, which will be our data sources.
  #----------------------------------------------------------------------------
  # OPC UA Connection
  #----------------------------------------------------------------------------

  opcuaConnection:
    type: Cybus::Connection
    properties:
      protocol: Opcua
      connection:
        host: !ref opcuaHost
        port: !ref opcuaPort
        #username: myUsername
        #password: myPassword

  Humidity:
    type: Cybus::Endpoint
    properties:
      protocol: Opcua
      connection: !ref opcuaConnection
      subscribe:
        nodeId: ns=3;s=AirConditioner_1.Humidity

  PowerConsumption:
    type: Cybus::Endpoint
    properties:
      protocol: Opcua
      connection: !ref opcuaConnection
      subscribe:
        nodeId: ns=3;s=AirConditioner_1.PowerConsumption

  Temperature:
    type: Cybus::Endpoint
    properties:
      protocol: Opcua
      connection: !ref opcuaConnection
      subscribe:
        nodeId: ns=3;s=AirConditioner_1.Temperature
Code-Sprache: YAML (yaml)
We define another connection for storing the collected data in an InfluxDB. The InfluxDB will be set up later in this lesson but we already know that it will be running within the Connectware as a containerized application. For the specific case of accessing a containerized application within the Connectware, the host has to be defined as connectware. The InfluxDB will be available on port 8086 of that container. The name of the InfluxDB bucket to store information is not really important in this use case and will be set to generic. The transport scheme will be set to http.
We also define an endpoint for the InfluxDB connection which will carry out queries to write data to the InfluxDB. Which data will actually be written to the database will be defined in the next step.
#----------------------------------------------------------------------------
# InfluxDB Connection
#----------------------------------------------------------------------------
 influxdbConnection:
   type: Cybus::Connection
   properties:
     protocol: Influxdb
     connection:
       host: connectware
       port: 8086
       bucket: generic
       scheme: http

 airconditionerWrite:
   type: Cybus::Endpoint
   properties:
     protocol: Influxdb
     connection: !ref influxdbConnection
     write:
       measurement: airconditioner
Code-Sprache: YAML (yaml)
To learn more about the details of defining connections and endpoints utilizing various protocols, explore other lessons on Cybus Learn. To learn more about the setup of an OPC UA connection and endpoints, have a look at the article How to Connect to an OPC UA Server. For details of further protocols you can also consult the Protocol Details in our Docs.
The data collected by our OPC UA endpoints should be available to our service on the MQTT data interface provided by the Connectware MQTT Broker. So we create a mapping from the OPC UA endpoints to the desired MQTT topics. The mqttMapping subscribes to the endpoints we created previously and which we refer to by name utilizing the !ref operator followed by the resource’s name. The mapping then publishes the data to the specified topic.
 #----------------------------------------------------------------------------
 # MAPPINGS
 #----------------------------------------------------------------------------

  mqttMapping:
    type: Cybus::Mapping
    properties:
      mappings:
        - subscribe:
            endpoint: !ref Humidity
          publish:
            topic: 'building-automation/airconditioner/1/humidity'
        - subscribe:
            endpoint: !ref PowerConsumption
          publish:
            topic: 'building-automation/airconditioner/1/power-consumption'
        - subscribe:
            endpoint: !ref Temperature
          publish:
            topic: 'building-automation/airconditioner/1/temperature'
Code-Sprache: YAML (yaml)
We create another mapping resource which will be responsible for mapping data from the MQTT topics to the endpoint airconditionerWrite, again referenced with the !ref operator. We will additionally do some data pre-processing in this mapping to get the information about the datas origin to the database and for that we utilize a so-called rule. This rule is based on a JSONata expression which will add the name of the last subtopic to the message’s JSON string under the key “measurement”. The value of this key will overwrite the default measurement name we defined in the endpoint definition when sent to InfluxDB. It is determined by the + operator in the subscribe-topic definition that acts as a wildcard while deriving a context variable named measurement.
  influxdbMapping:
    type: Cybus::Mapping
    properties:
      mappings:
       - subscribe:
           topic: 'building-automation/airconditioner/1/+measurement'
         publish:
           endpoint: !ref airconditionerWrite
         rules:
           - transform:
               expression: '$merge([$,{"measurement": $context.vars.measurement}])'
Code-Sprache: YAML (yaml)
For more information on the creation of mappings again take a look at the lesson How to connect to an OPC UA server.
A volume is a resource that represents a storage space and can be associated with containers. We want to utilize two containers, which will need additional storage space, so we create a volume for each of them.
  #----------------------------------------------------------------------------
  # VOLUMES
  #----------------------------------------------------------------------------

  grafanaVolume:
    type: Cybus::Volume

  influxdbVolume:
    type: Cybus::Volume
Code-Sprache: YAML (yaml)The service containers running within the Connectware architecture are not directly exposed and are running separate from the Connectware core containers for security reasons. To make them accessible from the outside as well as from within Connectware we have to define an ingress route for each of them.
Ingress routes allow services to provide web dashboards and REST APIs which can then be accessed through the HTTPS interface of the Cybus Connectware. In this case we define an HTTP interface and point it to port 3000 on the Grafana container which will allow us to access the dashboards.
#----------------------------------------------------------------------------
# INGRESS ROUTES
#----------------------------------------------------------------------------

  # Grafana
  grafanaURL:
    type: Cybus::IngressRoute
    properties:
      container: !ref genericGrafana
      type: http
      slug: grafana
      target:
        path: '/'
        port: 3000
Code-Sprache: YAML (yaml)
Ingress routes also allow communication between the Connectware core containers and custom containers utilized by services. For the InfluxDB container we define a tcp route between the container port 8086, on which the InfluxDB is available, and the Connectware port 8086, which we defined our InfluxDB connection to connect to.
 # InfluxDB
 influxdbRoute:
   type: Cybus::IngressRoute
   properties:
     container: !ref influxdb
     type: tcp
     containerPort: 8086
     connectwarePort: 8086
Code-Sprache: YAML (yaml)
To learn more details about ingress route resources take a look at the Connectware Docs.
For accessing the dashboard on the frontend, we define a link to the Grafana ingress route, which will simply provide a button named Dashboard on our service details view in the Connectware Admin UI.
#----------------------------------------------------------------------------
# FRONTENDS
#----------------------------------------------------------------------------

  dashboard:
    type: Cybus::Link
    properties:
      name: Dashboard
      ingressRoute: !ref grafanaURL
      href: ''
Code-Sprache: YAML (yaml)The containers section comprises the Docker Containers the service will run. These containers can either come from the Official Docker Registry or from the Cybus Registry. That means any application that is deployed on Connectware can take full advantage of all the containerized software on Docker Hub and your custom containerized software delivered securely through the Cybus Registry. In the example below we pull the official InfluxDB image from Docker Hub and a pre-configured version of Grafana from the Cybus registry. Several options that can be used when configuring these containers can be found in the Connectware Docs. For the container-specific environmental variables defined under the property environment, you should consult the container’s documentation.
#----------------------------------------------------------------------------
# CONTAINERS
#----------------------------------------------------------------------------
influxdb:
type: Cybus::Container
properties:
image: image: registry.hub.docker.com/library/influxdb:1.8-alpine
volumes:
- !sub '${influxdbVolume}:/var/lib/influxdb'
environment:
INFLUXDB_DB: generic
INFLUXDB_HTTP_FLUX_ENABLED: true
genericGrafana:
type: Cybus::Container
properties:
image: registry.cybus.io/cybus-services/generic-grafana:1.3.0
volumes:
- !sub '${grafanaVolume}:/var/lib/grafana'
environment:
GF_SERVER_ROOT_URL: !sub '/services/${Cybus::ServiceId}/grafana'
GF_AUTH_ANONYMOUS_ENABLED: true
INFLUX_HOST: !ref influxdb
INFLUX_PORT: 8086
INFLUX_DB: generic
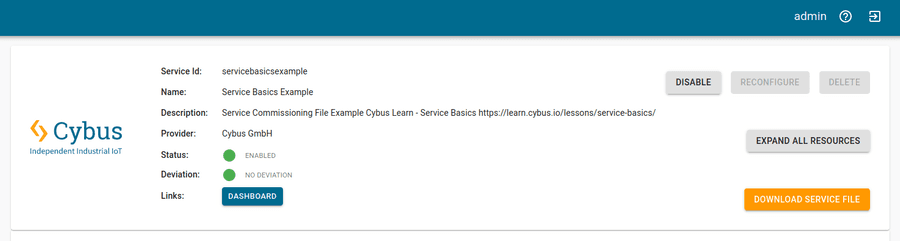
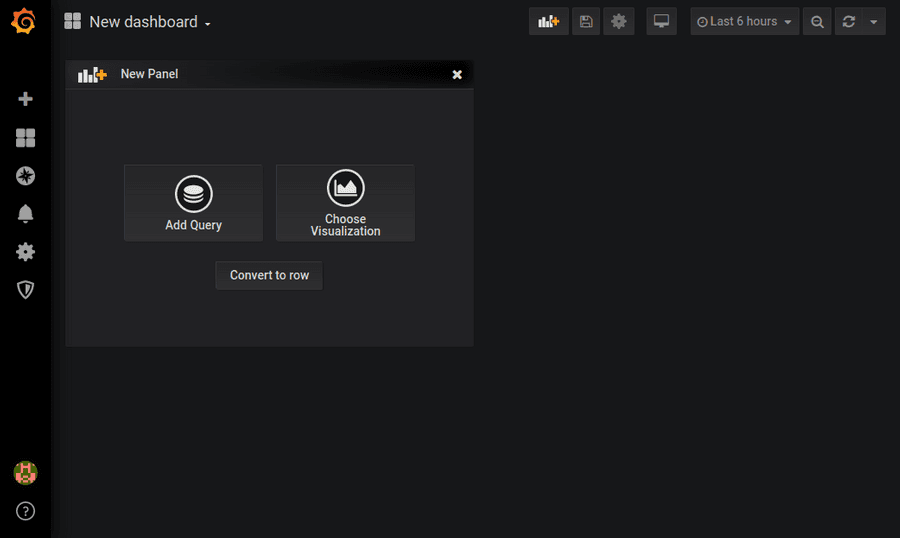
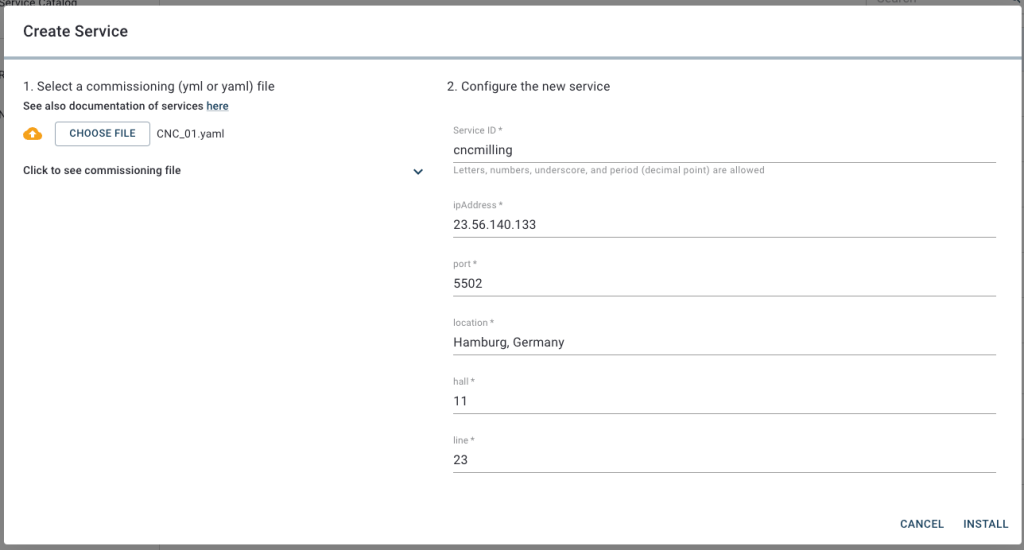
Code-Sprache: YAML (yaml)Now that we know what a service is and we have configured our own example we can install it on the Connectware. The service commissioning file can be found on GitHub.
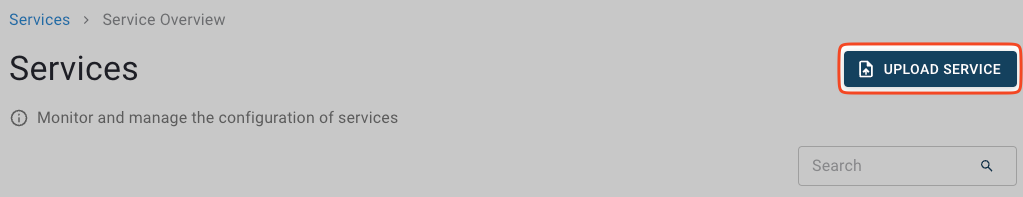
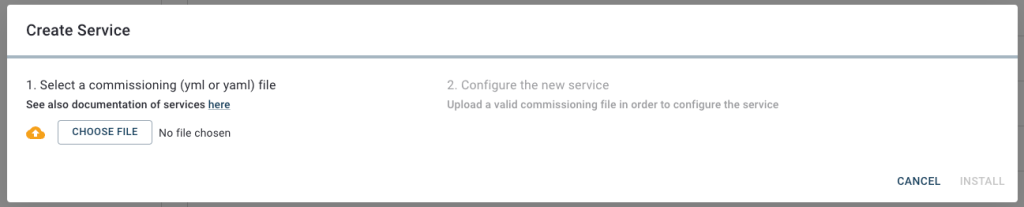
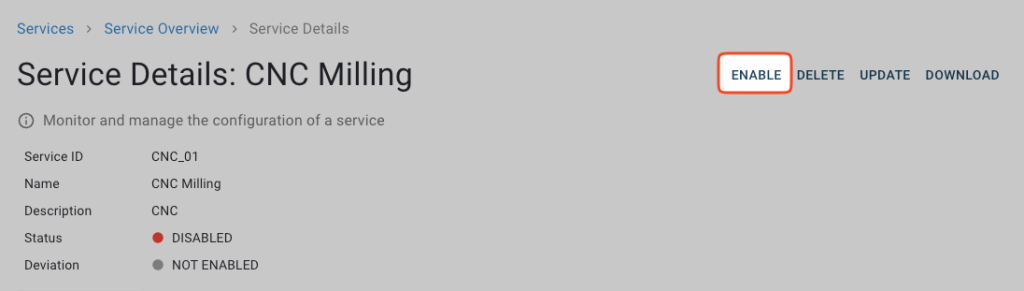
service-example-commissioning-file.yml on your computer and click Install to confirm the default values and start the installation.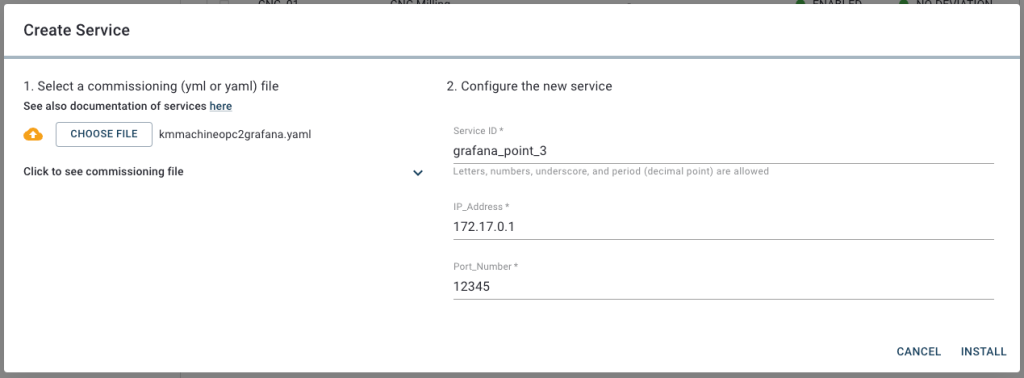
Now that you have successfully installed and enabled a service we can use the provided dashboard and configure Grafana to visualize our simulation data.
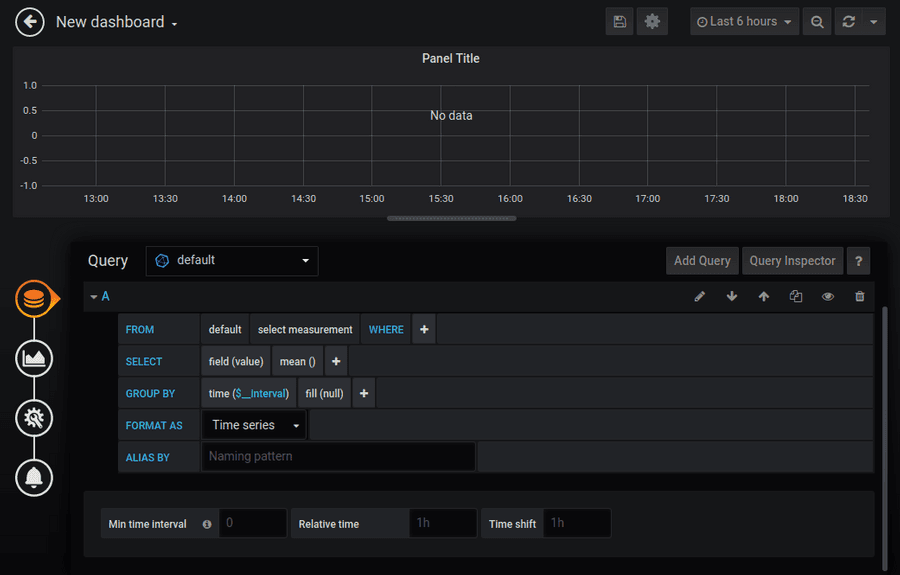
The query editor for Grafana is incredibly powerful and can do much more then we will show in this tutorial. For more details read the documentation here.
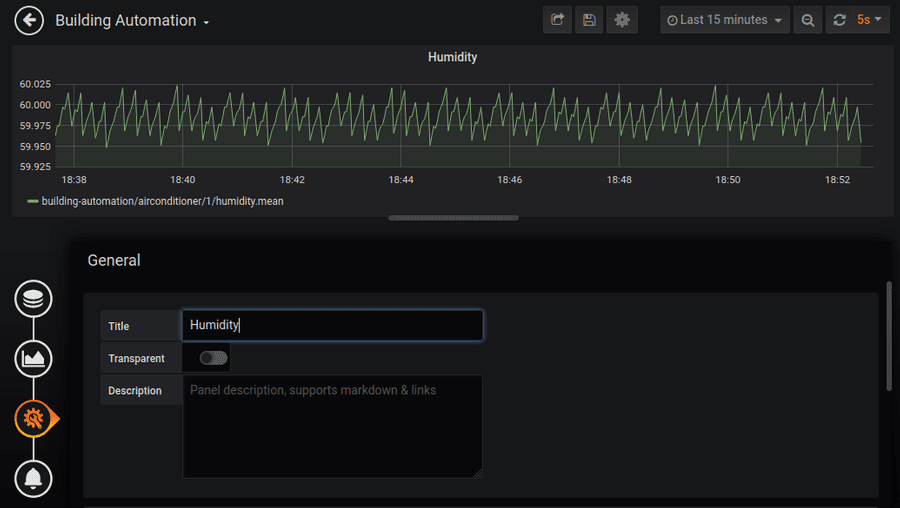
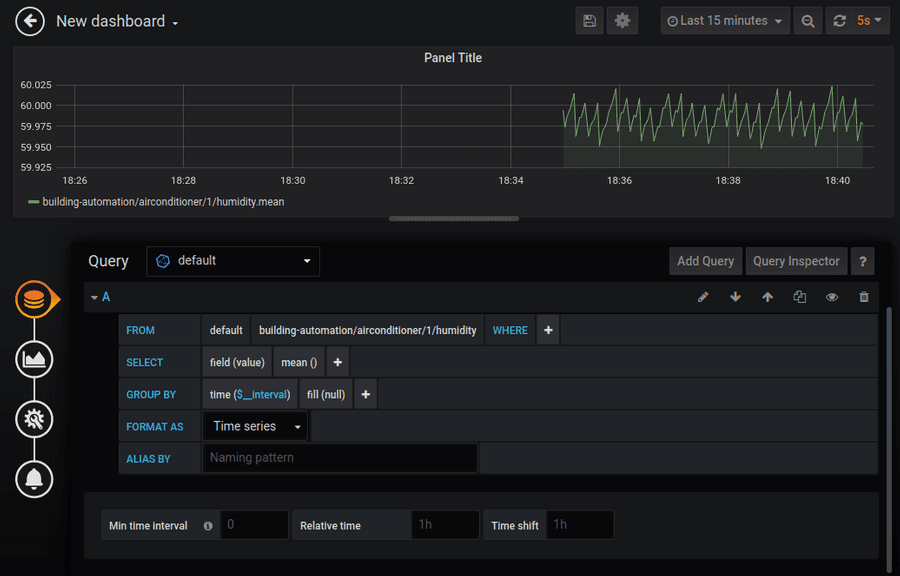
In this lesson we learned what services are and made a basic Grafana service whose configuration gave a short demonstration of the various resources a service can utilize and how they are configured to create a consistent context of cooperation. We then configured Grafana to visualize humidity data from our simulation OPC UA server.
This article should have given you an overview over the possibilities that services offer in terms of interconnectivity. Knowing the methods of utilizing containers, including data sources, organizing their data flow and managing their access permissions should give you a hint of how you can structure the first own commissioning file for your Connectware!
Learn more about Cybus Connectware in our Connectware Docs or explore more lessons here on Cybus Learn. If you would like to know how to include user management in your service, take a look at the lesson on User Management. You can also find more information about using the Grafana service in the Grafana Documentation.
In this lesson you will learn the basics about creating and managing users and their permissions. To understand the basic concepts of the Connectware, please check out the Technical Overview lesson. To follow along with the example, you will also need a running instance of the Connectware. If you don’t have that, learn How to install the Connectware. You should also be familiar with MQTT. If in doubt, head over to our MQTT Basics lesson.
This article will enable you to do the following:
In the following we will take a look at the first steps of user management: How to define a set of permissions, create a user and make him/her a useful member of the team. We will do this two times, first manually and then with a Commissioning File.
This lesson will guide you through the very basics of user management in a casual way. If you need any detailed instruction take a look at the User Management section in the Reference docs.
The Commissioning Files used in this lesson are made available in the Example Files Repository on GitHub.
First go ahead and log in to the Connectware using your admin account. Once you are successfully logged in you have all the tools available you need to manage users and permissions directly from the Connectware Admin User Interface (Admin UI).
Expand the section User Management on the menu bar by clicking on it. It will present three options to you:
If you want to learn more about Client Registry check out the How to MQTT lesson, which includes a hands-on example of self registration.
Now we will start right away with the definition of a Role.
To create a set of permissions switch to the section Roles. Here you can see all the roles that are available on your Connectware. To create a new role click the plus-button in the upper right corner of the UI. A dialog opens which demands you to define a name. We choose the name „UserManagement“ and click Create. The newly created role does now appear in the list. Clicking on this entry will open the permissions view. Here you can switch between MQTT, the data interface, and HTTP, the application programming interface.
We start with an MQTT permission by selecting the MQTT tab and clicking the plus-button in the upper right corner of the permissions list. An MQTT permission is easily to define and requires just two parts of information:
For the resource we define the MQTT topics located under users/# (with the wildcard # indicating that this is valid for the topic users as well as every subtopic) with Read and Write permission and confirm by clicking Add.
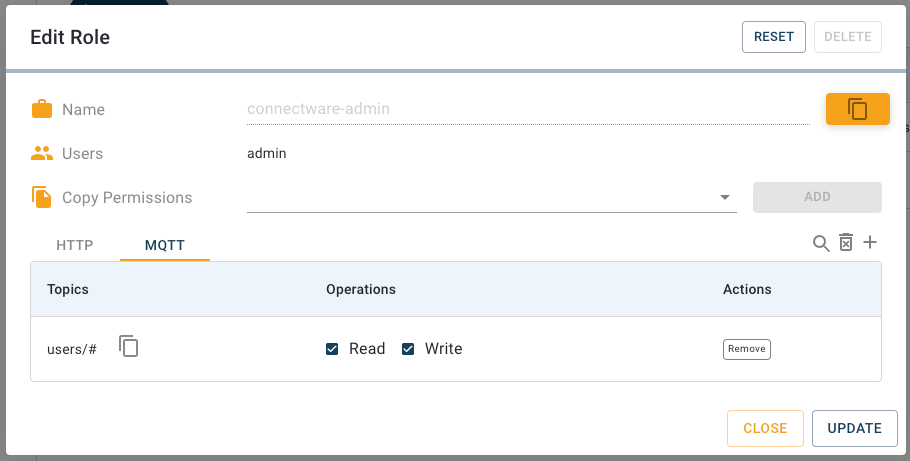
Now we again click the plus-button in the upper right corner. The second permission shall grant access to the HTTP API on path /api/users/# (again utilizing the wildcard #) which includes the interface for user management. In result assigning a user the role UserManagement will grant him rights to manage users via the HTTP API. Please note, that this does not grant access to the Admin UI nor its User Management section!
After creating both permissions click Update and Close. This role is now ready to use.
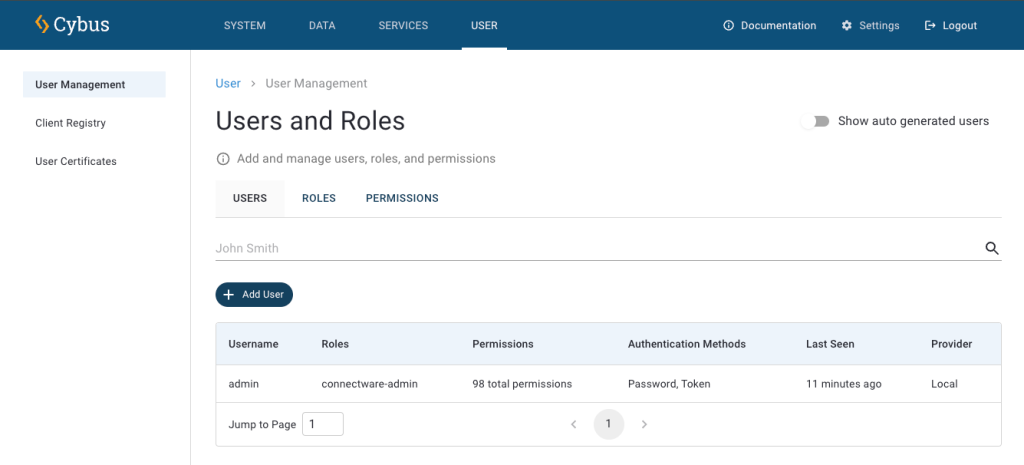
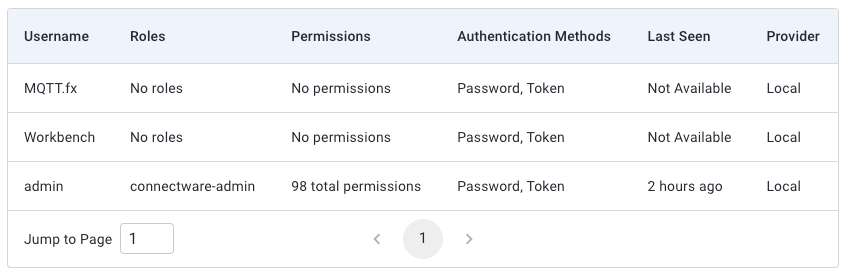
Go ahead and open the Users view. Unless you have not already configured any users yourself or installed any services, there is only a single user in the list: the admin. We will start off by creating a new user. To do so you only need to press the plus-button located in the upper right corner of the UI. Once you pressed the button, a dialog will appear in which you can set the username and the initial password.
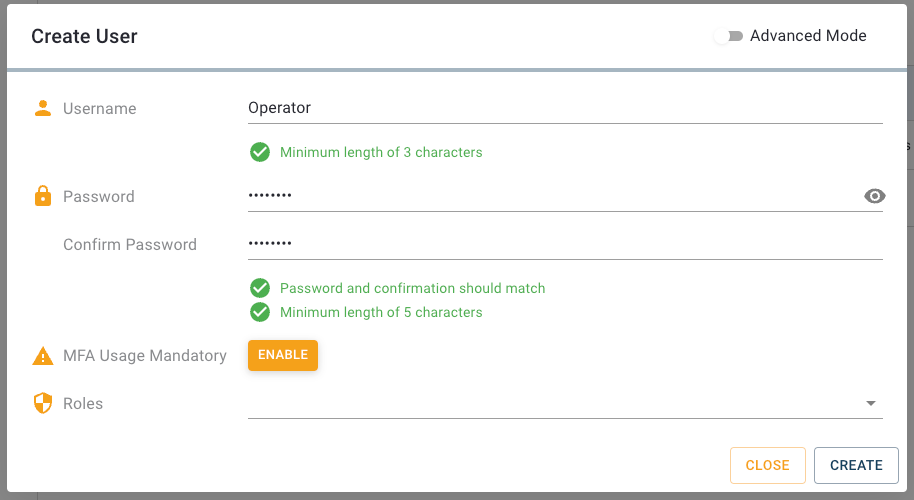
For this lesson we will create a simple user called user. Enter the username and a password. We will delete the user at the end of the lesson so the password doesn’t have to be particularly complex. Accept the new user by clicking Create. The menu will close and you will see that your new user appears in the list.
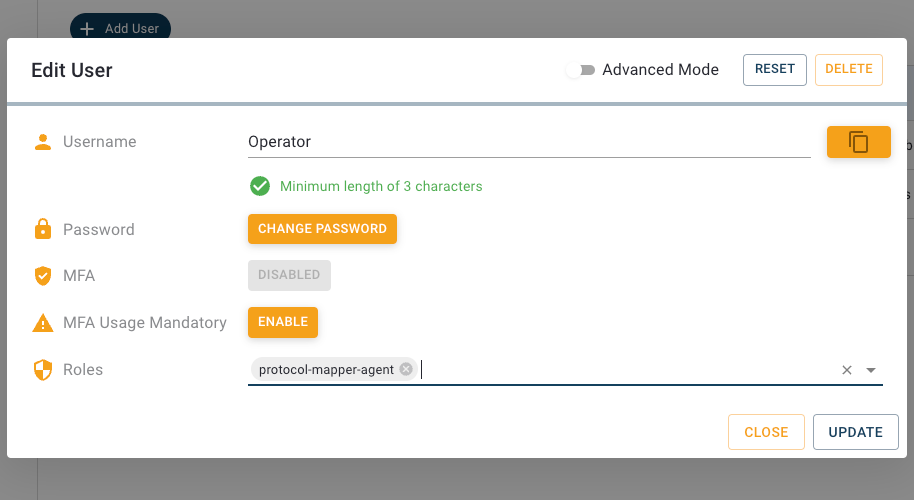
Right now our new user has no permissions to access the API or read data. To make the user a bit more useful we will go ahead and add a few permissions by assigning a role. Open the user configuration by clicking the entry of our user in the list and activate the “Advanced mode”. This view provides the following options:
We want to assign the earlier created role to this user, so we type „UserManagement“ to the input line Roles and select it from the list. Since we created the set of permissions for this user as a role, which by the way is considered good practice, we don’t need to grant additional permissions. But if we wanted to, it would work just like assigning permissions to a role, by clicking the plus-button.
Great! Our newly created user is now able to read and write data on the users topic and access the user management API.
Sometimes a good member of the team has to leave and you might be in charge of delivering the bad news. Luckily the Connectware makes this task a piece of cake! Just go to the Users view, choose the poor candidate’s entry in the list and click it. In the user configuration click Delete in the upper right corner and confirm if you are certain about it. Proceed like this for our user to continue with the lesson.
Instead of adding users utilizing the User Management section of the Admin UI, you can also define users in a Commissioning File and create them as part of a service installation. You would probably do that in the process of integrating a device that connects to the Connectware API, to have a user directly associated with the service which would reduce the required user management effort because you do not have to create, manage and remove users manually when installing or deleting services.
The Commissioning File contains all information which is required for a Service installation. It defines all kinds of resources needed, like connections, mappings or also users. To understand the file’s anatomy in detail, please consult the Reference docs. To get started, open a text editor and create a new file, e.g. users-example-commissioning-file.yml. The Commissioning File is in the YAML format, perfectly readable for human and machine! We will now go through the process of defining the required sections for this example:
These sections contain more general information about the commissioning file. You can give a short description and add a stack of metadata. Regarding the metadata, only the name is required while the rest is optional. We will just use the following set of information for this lesson:
description: >

  User Management Example Commissioning File
  Cybus Learn - User Management Basics
  https://learn.cybus.io/lessons/user-management-basics/

metadata:

  name: User Management Example
  version: 0.0.1
  icon: https://www.cybus.io/wp-content/uploads/2019/03/Cybus-logo-Claim-lang.svg
  provider: cybus
  homepage: https://www.cybus.io
Code-Sprache: YAML (yaml)
Parameters allow the user to customize Commissioning Files for multiple use cases by referring to them from within the Commissioning File. Each time a Commissioning File is applied or reconfigured in the Connectware, the user is asked to enter custom values for the parameters or to confirm the default values.
parameters:

  userPassword:
    type: string
    description: Password for user
Code-Sprache: YAML (yaml)
We are defining the user’s password as a parameter without any default, so it has to be set during the installation of the service.
In the resources section we declare every resource that is needed for our service. Besides resources like connections, endpoints or volumes, the user we want to create is also a resource which has to be defined in this section. And even the role we want to assign to our new user is a resource and that is what we start with.
The name of the role that will be created, will match the name of the resource we define, so we just name the resource UserManagement.
resources:

  UserManagement:
    type: Cybus::Role
    properties:
      permissions:
        - resource: users/#
          operation: readWrite
          context: mqtt
        - resource: /api/users/#
          operation: readWrite
          context: http
Code-Sprache: YAML (yaml)
This resource is of the type Cybus::Role which provides the single property permissions. Permissions are defined by the resource, which in this case is not a resource of those defined in the Commissioning File, but a resource path in the context of data interface (mqtt) or application programming interface (http).
We define two permissions here. The first is the permission to access data on MQTT topics located under users/# (with the wildcard # indicating that this is valid for the topic users as well as every topic under it). The second permission grants access to the API on path /api/users/# (also utilizing the wildcard #) which includes the interface for user management. In result assigning a user the role UserManagement will grant him rights to manage users via the HTTP API. Please note, that this does not grant access to the Admin UI nor its User Management section!
Again the name of the user that will be created, will be equal to the name of the resource we define, so we just name the resource user, like we did before.
  user:
    type: Cybus::User
    properties:
      password: !ref userPassword
      roles:
        - !ref UserManagement
Code-Sprache: YAML (yaml)
Although the name of our resource already implies that it should be a user, we still have to define it explicitly by setting the property type to Cybus:User. This brings us to the next, type-specific properties: For the definition of the password we reference the parameter userPassword we declared earlier by using !ref and for the roles we assign the previously created role UserManagement.
We could also define additional permissions in the same way we did for the role but it is considered advisable to organize sets of permissions as roles and just assign those to users.
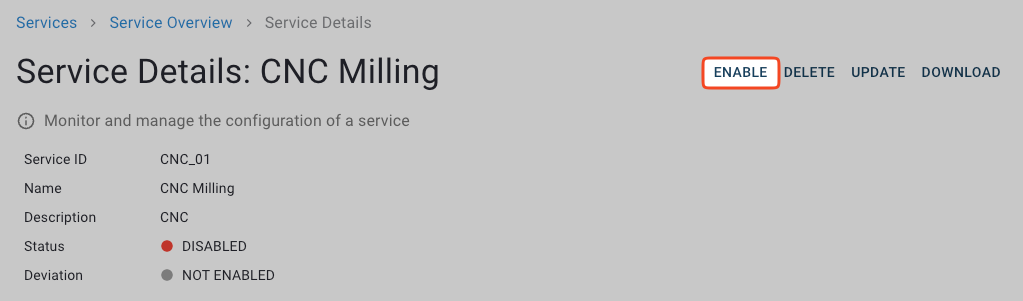
You now have the Commissioning File ready for installation. Head over to the Services tab in the Connectware Admin UI and hit the plus-button to select and upload the Commissioning File. You will be asked to specify values for the service ID and each member of the section parameters, in our case the password for the user. Once the service was installed successfully click its entry in the list and enable it from the service details view. You can now head back to the User Management and find the freshly created user and role. But they look a bit different as we might have expected: The names of our user and role come with the service ID of the associated service as a prefix. This prefix is also part of the credentials you will need for authorization of your client!
Furthermore we recognize that there are an additional user and role called <prefix>.defaultUser and <prefix>.defaultRole which are created by any service being enabled. Those do mainly serve its service’s concerns and you should just not care too much about them.
Since the user and role we defined in the Commissioning File are associated with the service, you should avoid to simply delete them from the lists. Doing this will be detected by the service and cause a deviation warning! The cleanest way of deleting them is to disable the service and if not needed anymore to delete the service too. Of course in most cases this would be the way to go anyhow because normally the created users become obsolete when the service is not needed anymore so you would delete the service and with it automatically the user and role.
After completing this lesson you should now have a better understanding of how user and permission management of the Connectware works. Keep in mind that service users should be created in their respective commissioning file.
The Connectware offers powerful features to build and deploy applications for gathering, filtering, forwarding, monitoring, displaying, buffering, and all kinds of processing data… why not build a dashboard for instance? For guides check out more of Cybus Learn.
This lesson assumes that you want to integrate a SICK sensor device via SOPAS protocol with the Cybus Connectware. To understand the basic concepts of the Connectware, please check out the Technical Overview lesson.
To follow along with the example, you will also need a running instance of the Connectware. If you don’t have that, learn How to install the Connectware.
Although we focus on SOPAS here, we will ultimately access all data via MQTT, so you should also be familiar with it. If in doubt, head over to our MQTT Basics lesson. When coming to the topic of the Rule Engine at the end it can be useful to have basic knowledge of JSON and JSONATA.
This article will teach you the integration of a SICK sensor device. In more detail, the following topics are covered:
The Commissioning Files used in this lesson are made available in the Example Files Repository on GitHub.
Our setup for this lesson consists of a SICK RFU620 RFID reading device. RFID stands for „Radio Frequency Identification“ and enables reading from (and writing to) small RFID tags using radio frequency. Our SICK RFU620 is connected to an Ethernet network on a static IP address in this lesson referred to as „myIPaddress“. We also have the Connectware running in the same network.
The protocol used to communicate with SICK sensors is the SOPAS command language which utilizes command strings (telegrams) and comes in two protocol formats: CoLa A (Command Language A) with ASCII telegram format, and CoLa B with binary telegram format, not covered here. Often, the terms SOPAS and CoLa are used interchangeably, although strictly speaking we will send the SOPAS commands over the CoLa A protocol format. In this lesson we use the CoLa A format only, as this is supported by our example sensor RFU620. (Some SICK sensors only support CoLa A, others only CoLa B, and yet others support both.)
The SICK configuration software SOPAS ET also utilizes the SOPAS protocol to change settings of a device and retrieve data. The telegrams used for the communication can be monitored with the SOPAS ET’s integrated terminal emulator. Additional documentation with telegram listing and description of your device can be obtained from SICK either on their website or on request.
For the integration we will need three pieces of information about the SOPAS commands we want to utilize:
1) Interface type: This part can be a bit tricky because the terminology used in device documentations may vary. The telegram listing of your device will probably group telegrams in events, methods and variables but sometimes you won’t find the term „variable“ but only the descriptions „Read“/“Write“.
2) Command name: Every event, method or variable is addressed using a unique string
3) Parameters: In case of variable writing or method calling some parameters may be required
The three interface types mainly have the following purposes:
The telegram listing from your device’s documentation is the most important source of this information. But for getting a hint of the structure of telegrams, we will take a short look at it.
For example, a command string for the RFU620 that we monitored with SOPAS ET’s integrated terminal emulator, could look like this:
sMN TAreadTagData +0 0 0 0 0 1
Code-Sprache: YAML (yaml)
The first parameter in this string is the command type which in case of a request can be of the following for us relevant values:
| Value | command type | interface type |
|---|---|---|
| sRN | Read | variable |
| sWN | Write | variable |
| sMN | Method call | method |
| sEN | Event subscription | event |
The command type is sMN (where M stands for „method call“, and N for the naming scheme „by name“ as opposed to „by index“). This command name TAreadTagData enables us to read data from an RFID tag. Following the command name there are several space-separated parameters for the method call, for example the ID of the tag to read from. In this case we could extract the name TAreadTagData and the type method from the command string for our Commissioning File but yet don’t know the meaning of each parameter so we still have to consult the device’s telegram listing.
For this lesson we have identified the following commands of our RFID sensor:
| Name          | Type     | Parameters  | Description           |
|---------------|----------|-------------|-----------------------|
| QSinv         | event    | -           | Inventory             |
| MIStartIn     | method   | -           | Start inventory       |
| MIStopIn      | method   | -           | Stop inventory        |
| QSIsRn        | variable | -           | Inventory running     |
| HMISetFbLight | method   | color, mode | Switch feedback light |
Code-Sprache: YAML (yaml)The Commissioning File contains all connection and mapping details and is read by the Connectware. To understand the file’s anatomy in detail, please consult the Reference docs. To get started, open a text editor and create a new file, e.g. sopas-example-commissioning-file.yml. The Commissioning File is in the YAML format, perfectly readable for human and machine! We will now go through the process of defining the required sections for this example:
These sections contain more general information about the commissioning file. You can give a short description and add a stack of metadata. Regarding the metadata only the name is required while the rest is optional. We will just use the following set of information for this lesson:
description: >

  SICK SOPAS Example Commissioning File for RFU620
  Cybus Learn - How to connect and use a SICK RFID sensor via SOPAS
  https://learn.cybus.io/lessons/how-to-connect-and-use-a-sick-rfid-sensor/

metadata:

  name: SICK SOPAS Example
  version: 1.0.0
  icon: https://www.cybus.io/wp-content/uploads/2019/03/Cybus-logo-Claim-lang.svg
  provider: cybus
  homepage: https://www.cybus.io
Code-Sprache: YAML (yaml)
Parameters allow the user to customize Commissioning Files for multiple use cases by referring to them from within the Commissioning File. Each time a Commissioning File is applied or reconfigured in the Connectware, the user is asked to enter custom values for the parameters or to confirm the default values.
parameters:

  IP_Address:
    description: IP address of the SICK device
    type: string
    default: mySICKdevice

  Port_Number:
    description: Port on the SICK device. Usually 2111 or 2112.
    type: number
    default: 2112
Code-Sprache: YAML (yaml)
We define the host address details of the SICK RFU620 device as parameters, so they are used as default, but can be customized in case we want to connect to a different device.
In the resources section we declare every resource that is needed for our application. The first resource we need is a connection to the SICK RFID sensor.
resources:

  sopasConnection:
    type: Cybus::Connection
    properties:
      protocol: Sopas
      connection:
        host: !ref IP_Address
        port: !ref Port_Number
Code-Sprache: YAML (yaml)
After giving our resource a name – for the connection it is sopasConnection – we define the type of the resource and its type-specific properties. In case of Cybus::Connection we declare which protocol and connection parameters we want to use. For details about the different resource types and available protocols, please consult the Reference docs. For the definition of our connection we refer to the earlier declared parameters IP_Address and Port_Number by using !ref.
The next resources needed are the endpoints which we supply data to or request from. Those are identified by the command names that we have selected earlier. Let’s add each SOPAS command by extending our list of resources with some endpoints.
  inventory:
    type: Cybus::Endpoint
    properties:
      protocol: Sopas
      connection: !ref sopasConnection
      subscribe:
        name: QSinv
        type: event

  inventoryStart:
    type: Cybus::Endpoint
    properties:
      protocol: Sopas
      connection: !ref sopasConnection
      write:
        name: MIStartIn
        type: method

  inventoryStop:
    type: Cybus::Endpoint
    properties:
      protocol: Sopas
      connection: !ref sopasConnection
      write:
        name: MIStopIn
        type: method

  inventoryCheck:
    type: Cybus::Endpoint
    properties:
      protocol: Sopas
      connection: !ref sopasConnection
      read:
        name: QSIsRn
        type: variable

  inventoryRunning:
    type: Cybus::Endpoint
    properties:
      protocol: Sopas
      connection: !ref sopasConnection
      subscribe:
        name: QSIsRn
        type: variable

  feedbackLight:
    type: Cybus::Endpoint
    properties:
      protocol: Sopas
      connection: !ref sopasConnection
      write:
        name: HMISetFbLight
        type: method
Code-Sprache: YAML (yaml)
Each resource of the type Cybus::Endpoint needs a definition of the used protocol and on which connection it is rooted. Here you can easily refer to the previously declared connection by using !ref and its name. To define a SOPAS command we need to specify the desired operation as a property which can be read, write or subscribe and among this the command name and its interface type. The available operations are depending on the interface type:
| Type     | Operation | Result                                     |
|----------|-----------|--------------------------------------------|
| event    | read      | n/a                                        |
|          | write     | n/a                                        |
|          | subscribe | Subscribes to asynchronous messages        |
| method   | read      | n/a                                        |
|          | write     | Calls a method                             |
|          | subscribe | Subscribes to method's answers             |
| variable | read      | Requests the actual value of the variable  |
|          | write     | Writes a value to the variable             |
|          | subscribe | Subscribes to the results of read-requests |
Code-Sprache: YAML (yaml)
This means our endpoints are now defined as follows:
inventory subscribes to asynchronous messages of QSinvinventoryStart calls the method MIStartIninventoryStop calls the method MIStopIninventoryCheck triggers the request of the variable QSIsRninventoryRunning receives the data from QSIsRn requested by inventoryCheckfeedbackLight calls the method HMISetFbLightThe accessMode is not a required property for SOPAS endpoints and is by default set to 0. But if you want to access specific SOPAS variables for write access which require a higher accessMode than the default 0 (zero), look up the suitable accessMode and its password in the SICK device documentation. Regarding the accessMode the Connectware supports the following values:
| Value | Name              |
|-------|-------------------|
| 0     | Always (Run)      |
| 1     | Operator          |
| 2     | Maintenance       |
| 3     | Authorized Client |
| 4     | Service           |
Code-Sprache: YAML (yaml)To this point we would already be able to read values from the SICK RFID sensor and monitor them in the Connectware Explorer or on the default MQTT topics related to our service. To achieve a data flow that would satisfy the requirements of our integration purpose, we may need to add a mapping resource to publish the data on topics corresponding to our MQTT topic structure.
mapping:
type: Cybus::Mapping
properties:
mappings:
- subscribe:
endpoint: !ref inventory
publish:
topic: 'sick/rfid/inventory'
- subscribe:
topic: 'sick/rfid/inventory/start'
publish:
endpoint: !ref inventoryStart
- subscribe:
topic: 'sick/rfid/inventory/stop'
publish:
endpoint: !ref inventoryStop
- subscribe:
topic: 'sick/rfid/inventory/check'
publish:
endpoint: !ref inventoryCheck
- subscribe:
endpoint: !ref inventoryRunning
publish:
topic: 'sick/rfid/inventory/running'
- subscribe:
topic: 'sick/rfid/light'
publish:
endpoint: !ref feedbackLight
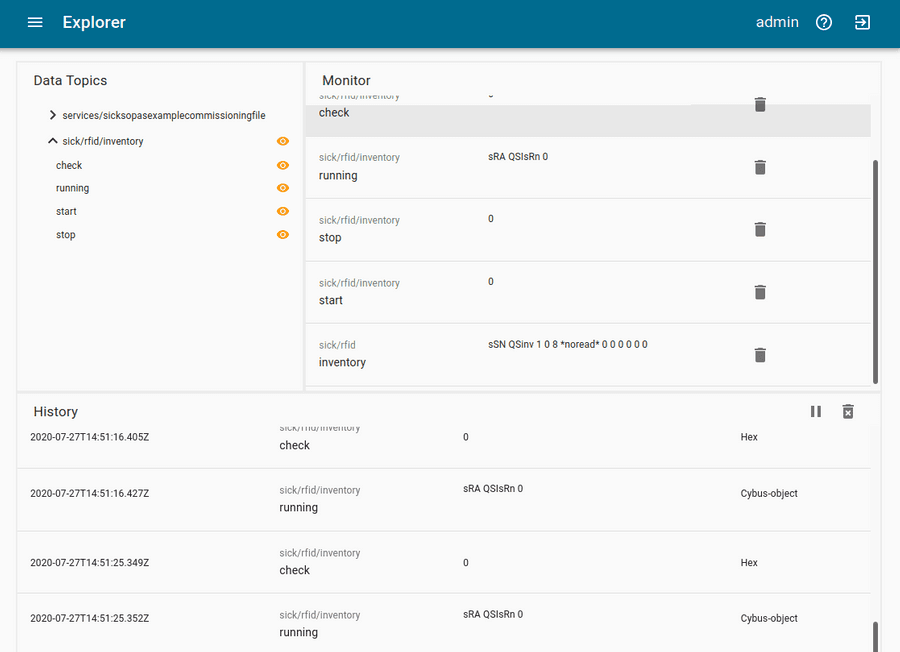
Code-Sprache: YAML (yaml)The mapping defines which endpoint’s value is published on which MQTT topic or the other way which MQTT topic will forward commands to which endpoint. In this example we could publish an empty message on topic sick/rfid/inventory/start to start RFID reading and publish an empty message on topic sick/rfid/inventory/stop to stop the reading process. While the reading (also referred to as inventory) is running, we continuously receive messages on topic sick/rfid/inventory containing the results of the inventory. Similarly when publishing an empty message on sick/rfid/inventory/check while having subscribed to sick/rfid/inventory/running, we will receive a message indicating if the inventory is running or not.
To provide parameters for variable writing or method calling you have to send them as a space-separated string. For instance, to invoke the method for controlling the integrated feedback light of the device just publish the following MQTT message containing a color and a mode parameter on topic sick/rfid/light: "1 2"
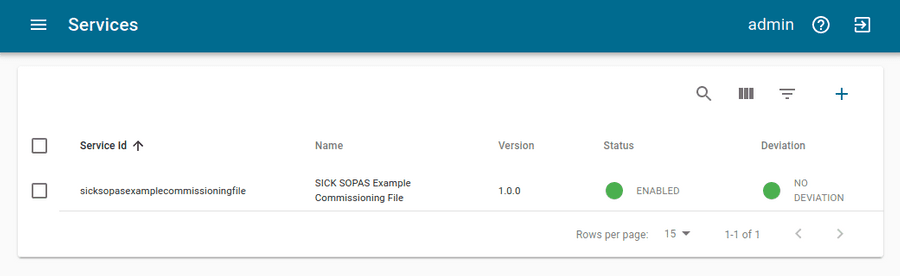
You now have the Commissioning File ready for installation. Head over to the Services tab in the Connectware Admin UI and hit the(+) button to select and upload the Commissioning File. You will be asked to set values for each member of the section parameters or confirm the default values. With a proper written Commissioning File, the confirmation of this dialog will result in the installation of a Service, which manages all the resources we just defined: The SOPAS connection, the endpoints collecting data from the device and the mapping controlling where we can access this data. After enabling this Service you are good to go on and see if everything works out!
The data is provided in JSON format and messages published on MQTT topics contain the keys "timestamp" and "value" like the following:
Although it is not represented by the Explorer view, on MQTT topics the data is provided in JSON format and applications consuming the data must take care of JSON parsing to pick the desired property. The messages published on MQTT topics contain the keys "timestamp" and "value" like the following:
{
  "timestamp": 1581949802832,
  "value": "sSN QSinv 1 0 8 *noread* 0 0 0 0 0 AC"
}
Code-Sprache: YAML (yaml)
This particular example is an inventory message published on topic sick/rfid/inventory. You recognize its "value" is a string in the form of the SOPAS protocol containing some values and parameters. This is the original message received from the SICK device which means you still have to parse it according to SOPAS specifications. The Connectware offers a feature that can easily help you along with this task and we will take a look at it in the next step.
For this lesson we will demonstrate the concept of the Rule Engine with a simpler example than the above. We will look at the answer to a variable read request, which is more intuitively to read since those messages usually only contain the variable’s value. For instance, this is the answer to inventoryCheck on endpoint inventoryRunning:
{
  "timestamp": 1581950874186,
  "value": "sRA QSIsRn 1"
}
Code-Sprache: YAML (yaml)
The SOPAS string contains just the command type (sRA = read answer), the variable name (QSIsRn) and the value 1 indicating that the inventory is running. But essentially we care about the value, because the command type is no further interesting for us and the information about the variable name/meaning is implied in the topic (sick/rfid/inventory/running). If this message is so easy to interpret for us, it can’t be too complicated for the Connectware – we just need the right tools! And that is where the Rule Engine comes into play.
A rule is used to perform powerful transformations of data messages right inside the Connectware data processing. It enables us to parse, transform or filter messages on the base of simple to define rules, which we can append to endpoint or mapping resource definitions. We will therefore extend the inventoryRunning resource in our Commissioning File as follows:
  inventoryRunning:
    type: Cybus::Endpoint
    properties:
      protocol: Sopas
      connection: !ref sopasConnection
      subscribe:
        name: QSIsRn
        type: variable
      rules:
        - transform:
            expression: |
               {
                 "timestamp": timestamp,
                 "value": $number($substringAfter(value, "sRA QSIsRn "))
               }
Code-Sprache: YAML (yaml)
We add the property rules and define a rule of the type transform by giving the expression which is a string in the form of JSONATA language. Rules of the type transform are direct transformations, generating for every input message, exactly one output message. The principle of the expression is, that you construct an output JSON object in which you can refer to keys of the input object (the JSON message of this endpoint) and apply a set of functions to modify the content. Please note that the pipe | is not part of the expression but a YAML specific indicator for multiline strings, denoting to keep newlines as newlines instead of replacing them with spaces.
We want to keep the form of the input JSON object, so we again define the key "timestamp" and reference its value to timestamp of the input object to maintain it. We also define the key "value" but this time we do some magic utilizing JSONATA functions:
$number(arg) casts the arg parameter to a number if possible$substringAfter(str, chars) returns the substring after the first occurrence of the character sequence chars in strThe second function will reduce the SOPAS string we refer to with value by returning just the characters after the string "sRA QSIsRn", in our case a single digit, which is then cast to a number by the first function. We can apply these functions in this way, because we know that the string before our value will always look the same. For more information about JSONATA and details about the functions see https://docs.jsonata.org/overview.html.
After installing the new Service with the modified Commissioning File, we do now receive the following answer to an inventoryCheck request (while inventory is running):
{
  "timestamp": 1581956395025,
  "value": "1"
}
Code-Sprache: YAML (yaml)
This value is now ready-to-use and applications working with this data do not have to care about any SOPAS parsing!
The Connectware supports some more types of rules. To give you a hint, what might be possible, here is a quick overview:
parse – parse any non JSON data to JSONtransform – transform payloads into new structurefilter – break the message flow, if the expression evaluates to a false valuesetContextVars – modify context variablescov – Change-on-Value filter that only forwards data when it has changedburst – burst-mode that allows aggregation of many messagesstash – stash intermediate states of messages for later referenceFor more information about rules and the Rule Engine check out the Connectware Docs.
We started this lesson with a few SOPAS basics and learned which information about the SOPAS interface is required to define the Commissioning File for the integration of our SICK RFU620. Then we created the Commissioning File and specified the SOPAS connection, the endpoints and the MQTT mapping. Utilizing the Commissioning File we installed a Service managing those resources in the Connectware and monitored the data of our device in the Explorer of the Admin UI. And in the end we had a quick look at possibilities of preprocessing data using the Rule Engine to get ready-to-use values for our application.
The Connectware offers powerful features to build and deploy applications for gathering, filtering, forwarding, monitoring, displaying, buffering, and all kinds of processing data… you could also build a dashboard for instance? For guides checkout more of Cybus Learn.
This lesson will explain how to connect and use an MQTT client utilizing Cybus Connectware. To understand the basic concepts of Connectware, check out the Technical Overview lesson. To follow along with the example, you will also need a running instance of Connectware. If you don’t have that, learn Installing Connectware. And finally this article is all about communication with MQTT clients. So unlikely but if you came here without ever having heard about MQTT, head over to our MQTT Basics lesson.
This article will teach you the integration of MQTT clients. In more detail, the following topics are covered:
In this lesson we will utilize a couple of MQTT clients, each fulfilling a different purpose and therefore all having their right to exist.
Mosquitto is an open source message broker which also comes with some handy client utilities. Once installed on your system it provides the mosquitto_pub and mosquitto_sub command line MQTT clients which you can use to perform testing or troubleshooting, carried out manually or scripted.
MQTT Explorer is an open-source MQTT client that provides a graphical user interface to communicate with MQTT brokers. It offers convenient ways of configuring and establishing connections, creating subscriptions or publishing on topics. The program presents all data clearly and in well organized sections but also enables the user to select which data should appear on the monitor, should be hid or dumped in a file. Additionally it provides tools to decode the payload of messages, execute scripts or track the broker status.
The Workbench is part of the Cybus Connectware. It is a flow-based, visual programming tool running a Node-RED instance to create data flows and data pre-processing on level of Connectware. One way to access data on Connectware utilizing the Workbench is via MQTT. The Workbench provides publish and subscribe nodes which serve as data sources or sinks in the modeled data flow and allows users to build applications for prototyping or debugging. But it is capable of a lot of more useful functions and nodes, for instance creating dashboards.
To connect users to Connectware, they need credentials for authorization. There are two ways to create credentials:
read, write, or readWrite permissions. These are equivalent to subscribe, publish, or subscribe and publish. In the Users and Roles list, click the user for which you want to add permissions.clients/#. This gives the selected user access to the clients topic. The wildcard # gives access to any topic that is hierarchically below clients. For example, clients/status/active.The second way of creating credentials for a user is the client registry process (also referred to as self registration). There are two variants of this process: The implicit form works with any MQTT client while the explicit form is for clients that use the REST API. In this lesson we will only look at the implicit variant. If you want to learn more on self registration and both of its forms, please consult the Reference docs.
We will now step through the process of implicit client registration. At first we need to activate the self registration: In the Connectware Admin UI navigate to User > Client Registry and click Unlock. This will temporarily unlock the self registration for clients. The next step is that the client tries to connect to Connectware with a username that does not yet exist.
We utilize the mosquitto_sub client for this which is especially easy because we just need to use the command mosquitto_sub -h localhost -p 1883 -u Mosquitto -P 123456 -t clients assuming we are running Connectware on our local machine and want to register the user Mosquitto with the password 123456 (you should of course choose a secure password). The topic we chose using option -t is not relevant, this option is just required for issuing the command. We will explain this command in detail in the section about subscribing data.
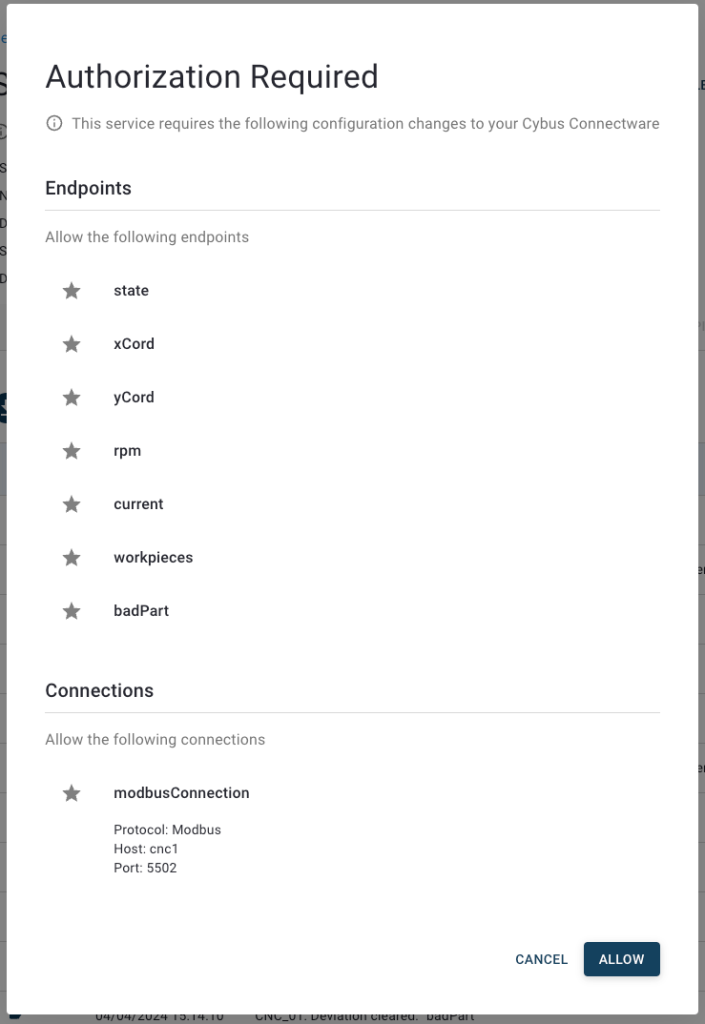
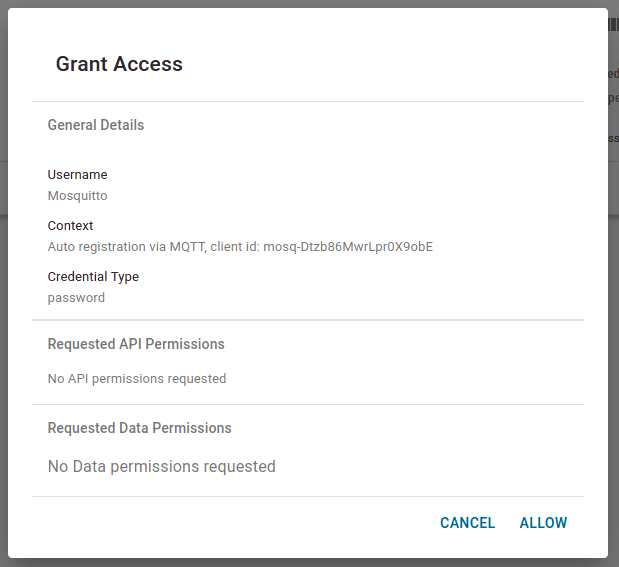
Shortly after we have issued this command and it exited with the message „Connection error: Connection Refused: not authorized.“ we can look at the Client Registry in the Admin UI and see the connection attempt of our Mosquitto client.
Clicking an entry in the list opens the Grant Access dialog. This summarizes the details of the request and the permissions requested. You can only request permissions using the explicit method. To grant access to this client and create a user, click Allow.
On the navigation bar, click User to see the newly created user „Mosquitto“. Since we are using the implicit method we now need to manually add permissions to the accessible topics as we did before.
We are now ready to connect our clients to Connectware via MQTT.
We already made use of the client functions of Mosquitto by utilizing it for our self registration example. That also suggested that we do not explicitly need to establish a connection before subscribing or publishing, this process is included in the mosquitto_sub and mosquitto_pub commands and we supply the credentials while issuing.
Using MQTT Explorer, we need to configure the connection.
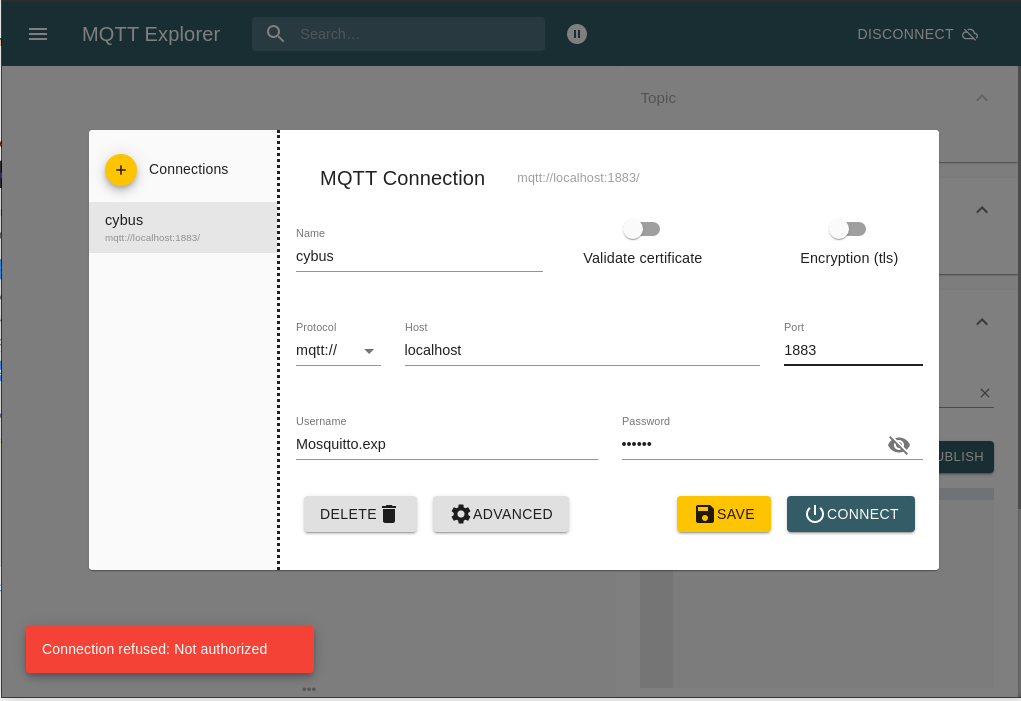
First we create a new connection by clicking the plus (+) in the top left corner. We name the new profile „cybus“ and define the host as „localhost“ (exchange this with the address you are running your Connectware on). Then fill out the user credentials. All other settings can remain default for this example. We also need to perform client registry since it is another client otherwise we get an error as show at the bottom left corner.
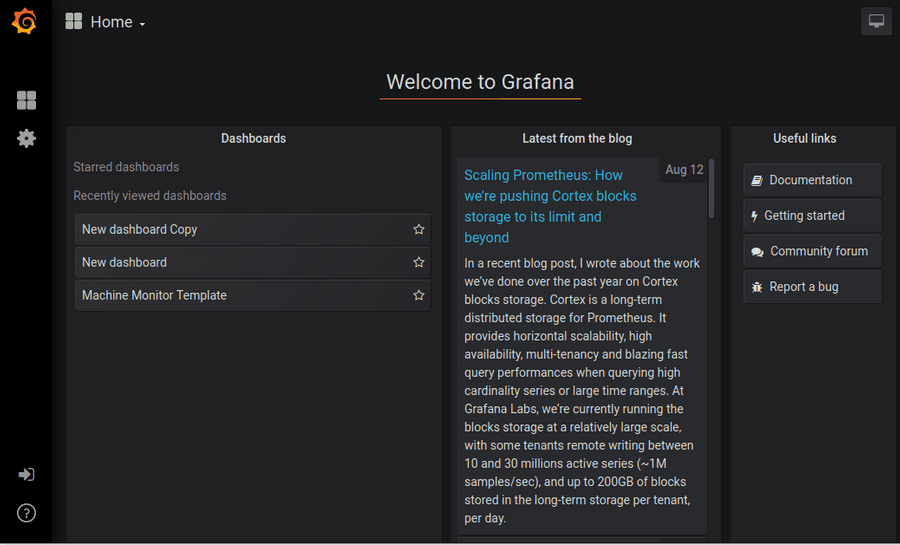
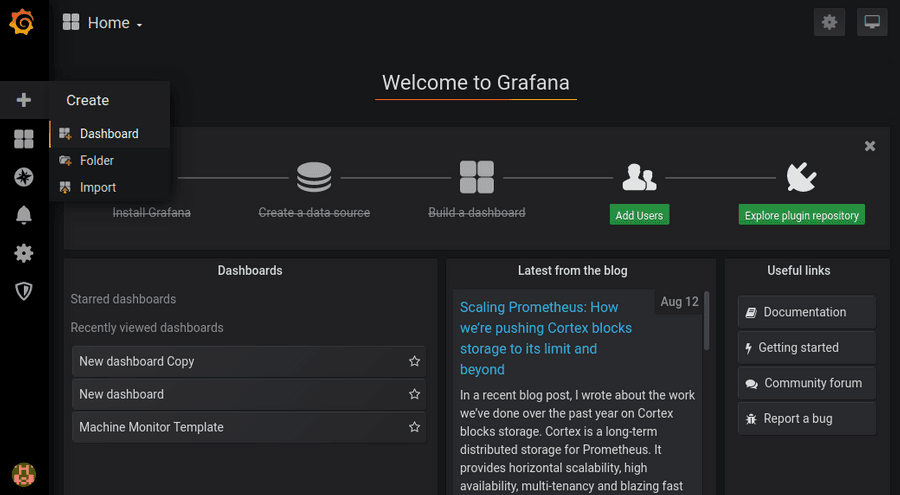
The Workbench can be accessed through the Admin UI by clicking Workbench in the navigation bar. A new tab will open showing the most recent edited flow of our Workbench. If it is empty you can use this otherwise click the (+) button to the upper right of the actual shown flow. If you are new to the Workbench, we won’t go into details about the functions and concepts in this lesson but it will demonstrate the most simple way of monitoring data with it.
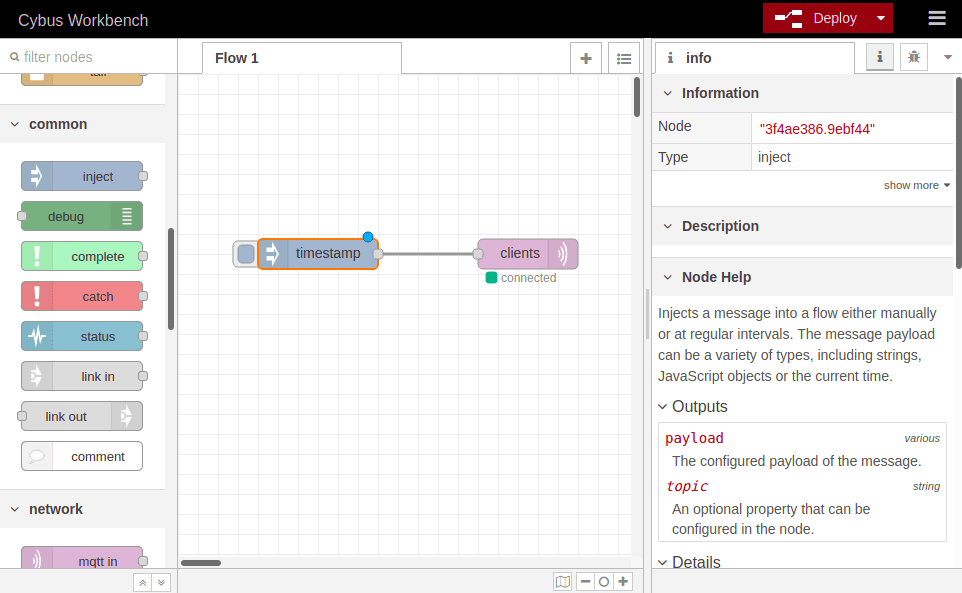
Take a look at the left bar: There you see the inventory of available nodes. Scrolling down you will find the section network containing two MQTT nodes among others. The so-called mqtt in and mqtt out nodes represent the subscribe and publish operations. Drag the mqtt out node and drop it on your flow, double-clicking it will show you its properties. The drop-down-menu of the Server property will allow you to add a new mqtt broker by clicking the pencil symbol next to it.
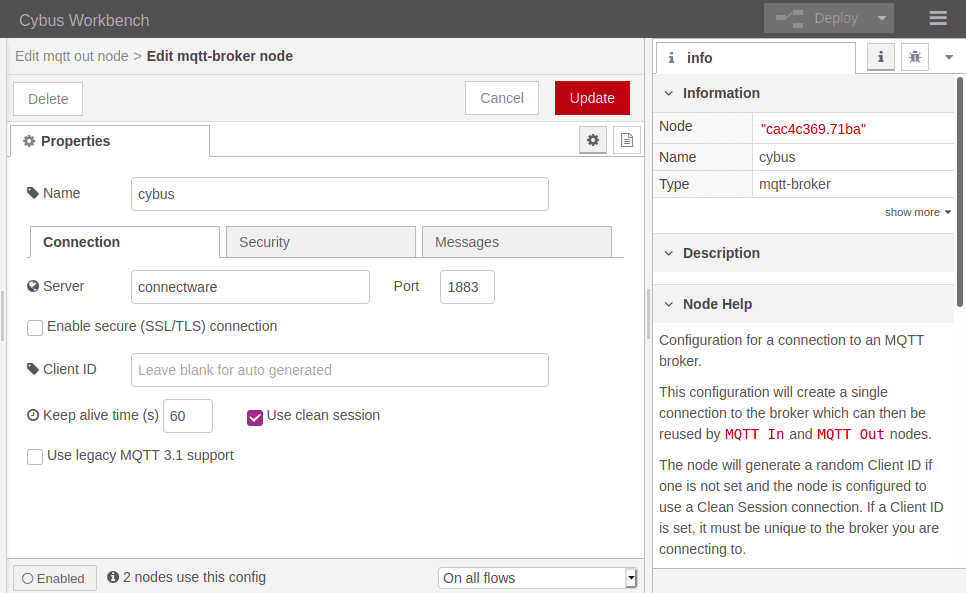
We name this new connection „cybus“ and define the server address as connectware. This is the way to address the local running Connectware, you won’t be able to access it using localhost! Now switch to the Security tab and fill in username and password. Save your changes by clicking Add in the upper right corner. Make sure the just created configuration is active for the Server property. For the property Topic we choose the topic we selected for our clients: clients/workbench. The other properties will keep their default settings. Click Done in the upper right corner.
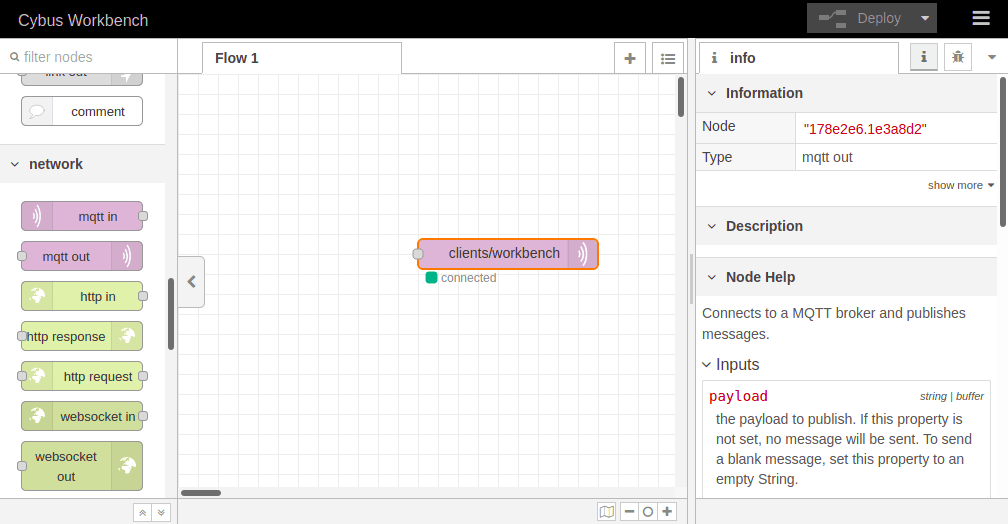
To apply the changes we just made click the button Deploy in the upper right corner. This will reset our flow and start it with the latest settings. You will now see that the MQTT node is displayed as „connected“, assuming everything was configured correctly. We successfully established a connection between the Workbench and our Connectware.
Publishing data allows us to make it available. It does not necessarily mean that someone is actually receiving it but anyone with the permission to subscribe on the concerning topic could.
Using Mosquitto publishing data can be achieved by a single command line utilizing mosquitto_pub. For this example we want to connect to Connectware using the following options:
-h localhost-p 1883-u Mosquitto-P 123456-t clients/mosquitto-m "Hello World"mosquitto_pub -h localhost -p 1883 -u Mosquitto -P 123456 -t clients/mosquitto -m "Hello World"
If successful the command will complete without any feedback message. We could not confirm yet if our message arrived where we expected it. But we will validate this later when coming to subscribing data.
Publishing with MQTT.fx is even simpler once the connection is configured and a connection is established (indicated by the gray/green circle in the upper right corner). If the indicator shows green, we are connected and ready to shoot some messages.
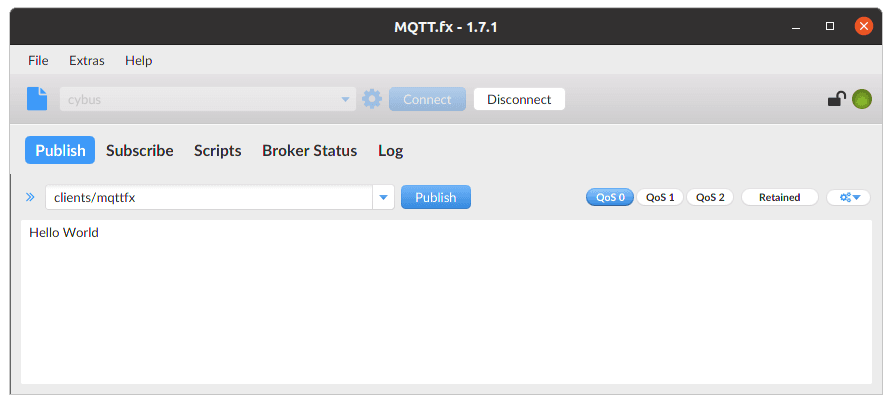
Switch to the Publish section. In the input line next to the Publish-button you define the topic you want to publish to. We will go for the topic clients/mqttfx. Then you click the big, blank box below and type a message, e.g. „Hello World“. To publish this message click Publish.
Again we have no feedback if our message arrived but we will take care of this in the Subscribing data section.
We already added a publishing node to our flow when we established a connection to Connectware and configured it to publish on clients/workbench. Having this set the Workbench is ready to publish but the messages are still missing.
At this point we want to create a data source in our flow which periodically publishes data through the mqtt out node. We simply drag an inject node from the nodes bar into our flow and drop it left to the mqtt out node. Now we can draw a connection from the small gray socket of one to the other node.
Double-clicking the inject node, which is now labeled „timestamp“, shows its properties. We can define the payload, but we will keep „timestamp“, declare a topic to publish to, which we leave blank because we defined the topic in out MQTT node, and we can set if and how often repeated the message should be injected in our flow. If we do not define repeating a message will be injected only if we click the button on the left of the inject node in our flow.
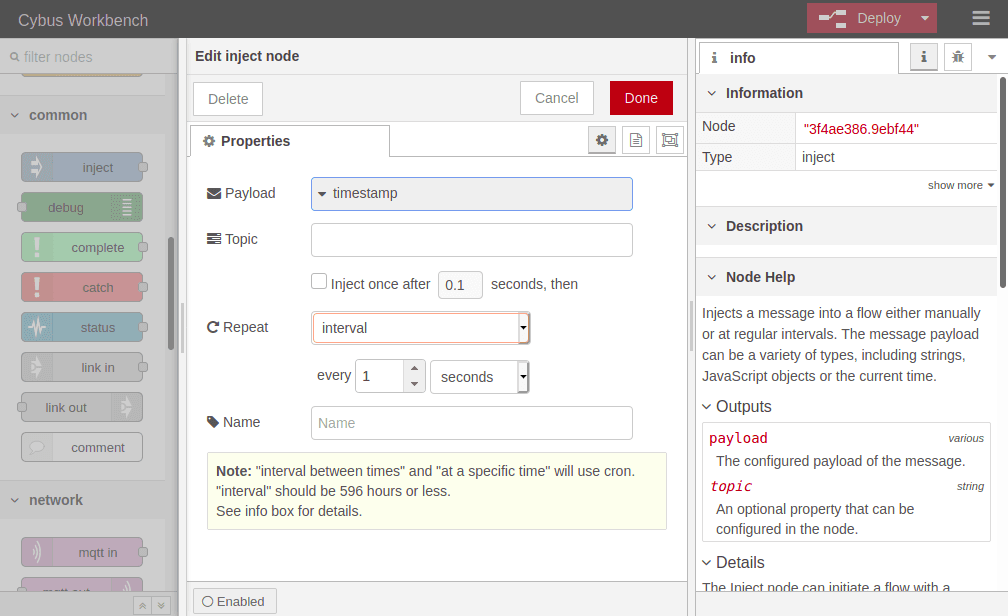
We set repeating to an „interval“ of every second and confirm the settings by clicking Done in the upper right corner. Now we have to Deploy again to apply our changes. We still have no confirmation that everything works out but we are confident enough to go on and finally subscribe to the data we are generating.
Subscribing data means that the client will be provided with new data by the broker as soon as it is available. Still we do not have a direct connection to the publisher, the broker is managing the data flow.
We already used mosquitto_sub to self register our client as a user. We could have also used mosquitto_pub for this but now we want to make use of the original purpose of mosquitto_sub: Subscribing to an MQTT broker. Not any broker but the broker of our Connectware.
We are using the following options:
-h localhost-p 1883-u Mosquitto-P 123456-t clients/workbenchmosquitto_sub -h localhost -p 1883 -u Mosquitto -P 123456 -t clients/workbench
Again make sure that you have specified the address of your Connectware as host which does not necessarily have to be your local machine! We will subscribe to the topic clients/workbench where we are publishing the messages from our Workbench.
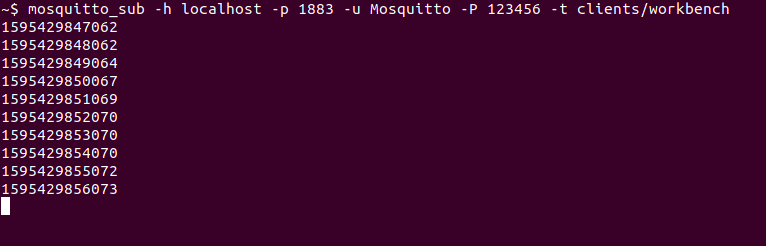
And Tada! The mosquitto client now shows us every new message published on this topic – in this case the timestamps generated by our Workbench.
Already having the connection to our Connectware established it is a piece of cake to subscribe to a topic. On the left side under localhost, we can see the messages coming:
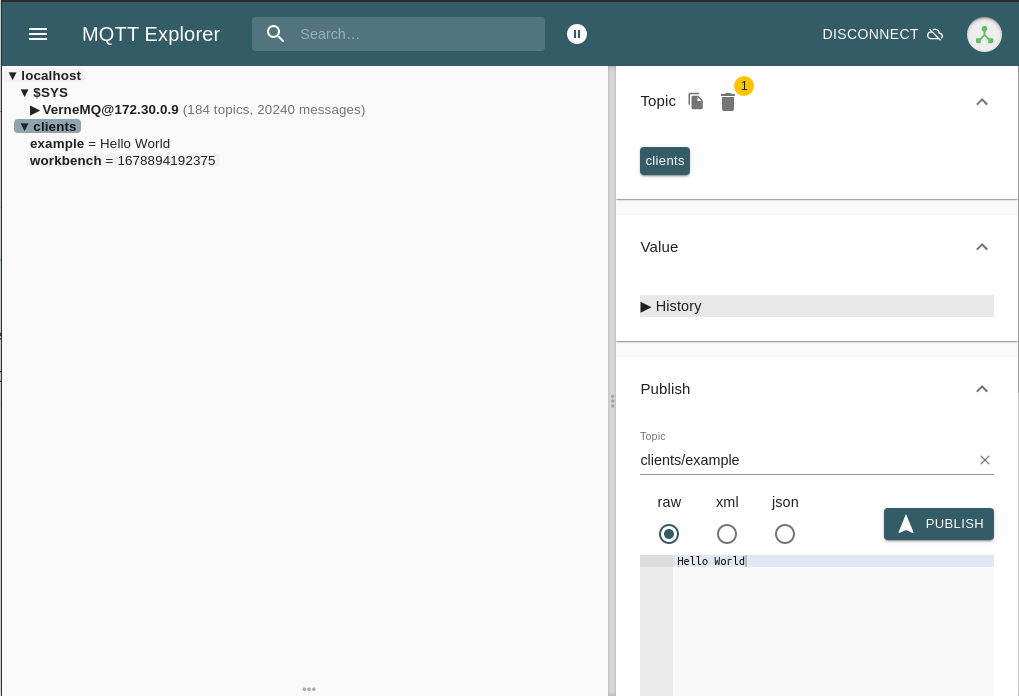
And there you see finely presented all the data flying in. You can also add more topics to be monitored simultaneously and manage which should be presented to you or be dumped in a file.
Eventually we will utilize the Workbench to monitor our data. But why just monitor it? The Workbench has a lot more to offer and exploring it will quickly give you a hint which possibilities lie ahead. But we will focus on that in another lesson.
At first we add an mqtt in node to the flow where we already created the data generator. Double-clicking it we choose the previously configured server „cybus“ and the topic clients/#. The wildcard # defines, that we subscribe to every topic under clients. Be careful using wildcards since you could accidentally subscribe to a lot of topics which could possibly cause very much traffic and a message output throwing data from all the topics in a muddle. Confirm the node properties by clicking Done and add a debug node to the flow. Draw a connection from the mqtt in to the debug node and Deploy the flow.
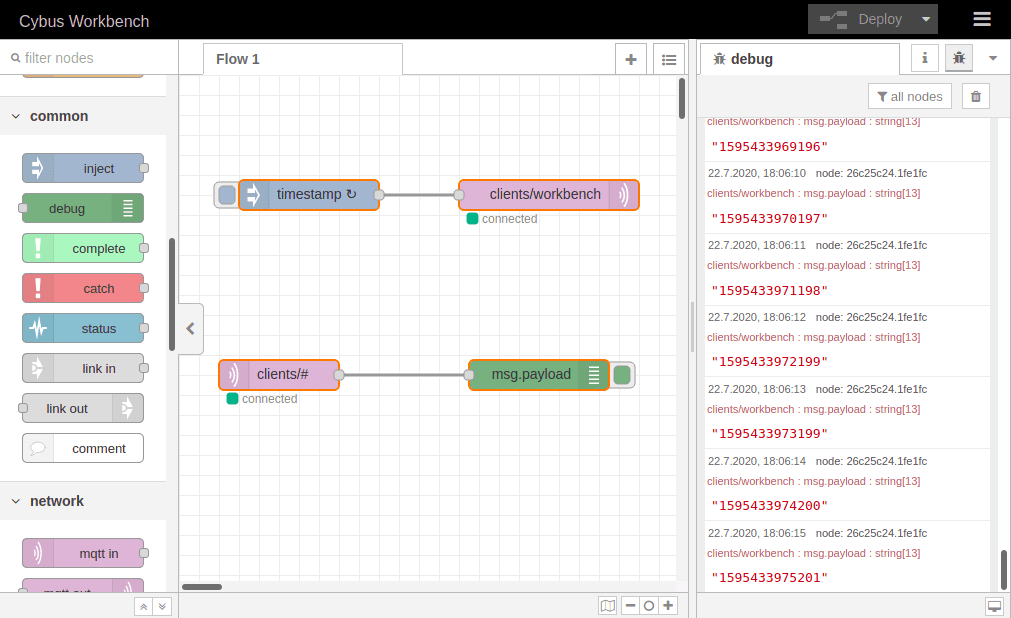
Click the bug symbol in the upper right corner of the information bar on the right. We see there are already messages coming in: They are the timestamp messages created in the very same flow but taking a detour via the MQTT broker before plopping in our debug window. They are messing up the show so let us just cut the connection between the „timestamp“ node and the publish node by selecting the connection line and pressing Del and Deploy the flow one more time.
Now that we have restored the quiet, let us finally validate if publishing with mosquitto_pub and MQTT.fx even works out. So issue the mosquitto_pub command again and also open MQTT.fx and publish a message like we did in the section before.
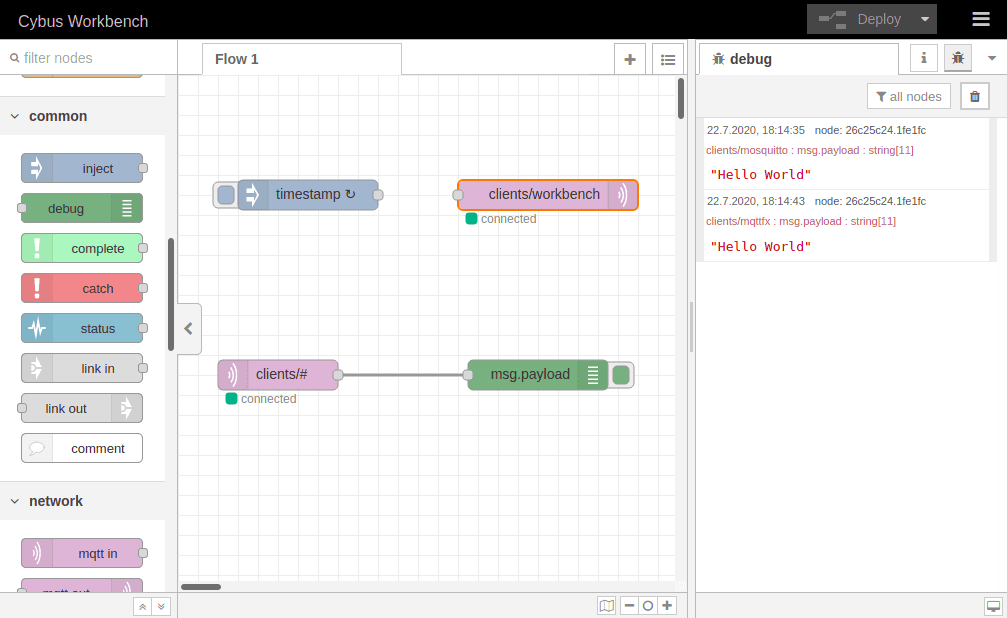
Et voilà! We can see two „Hello World“ messages in our debug window and looking at the topics they were published on (written small in red right above the message text) we learn that one came from Mosquitto and the other from MQTT.fx.
This was quite a journey! We started in the realms of Connectware, created credentials and permissions, learned about the magic of self registration and the trinity of MQTT clients. We went on and established connections between clients and brokers and sent messages to unobserved topics, struggling with the uncertainty of whether their destinations will ever be reached. But we saw light when we discovered the art of subscribing and realized that our troubles had not been in vain. In the end we received the relieving and liberating call of programmers: „Hello World“!
Connectware offers powerful features to build and deploy applications for gathering, filtering, forwarding, monitoring, displaying, buffering, and all kinds of processing data… why not build a dashboard for instance? For guides check out more of Cybus Learn.
We assume that you are familiar with the following topics:
This lesson goes through the required steps to connect and use your Siemens SIMATIC S7 device with Cybus Connectware. Following this tutorial will enable you to connect and use your own SIMATIC S7 device on Connectware with ease!
The SIMATIC S7 is a product line of PLCs by Siemens that are widely used in industrial automation. The S7 is capable of connecting several sensors and actuators through digital or analog IOs which can be modularly extended.
Reading and writing data on the PLC can be realized through the S7 communication services based on ISO-on-TCP (RFC1006). In this case the PLC acts as a server allowing communication partners to access PLC data without the need of projecting the incoming connections during PLC programming. We will use this feature to access the S7 from Connectware.
To follow this lesson you need to have a computer, a running Cybus Connectware instance and one of the following:
A Siemens S7 PLC and access to STEP7 (TIA Portal)
Conpot PLC Emulator
You can download the service commissioning file that we use in this example from the Cybus GitHub repository.
The YAML based Commissioning File tells Cybus Connectware the type of device to be connected, its connection configuration and it specifies the endpoints that should be accessed. Commissioning File details can be found in the Reference docs. For now let’s focus on the three main resources in the file, which are:
In the following chapters we will go through the three resources and create an example Commissioning File in which we connect to an S7 device and enable read/write access to a data endpoint.
Inside of the resource section of the commissioning file we define a connection to the device we want to use. All the information needed for Connectware to talk to the device is specified here. This information for example includes the protocol to be used, the IP address and so on. Our connection resource could look like the following:
# ----------------------------------------------------------------------------#
# Connection Resource - S7 Protocol
# ----------------------------------------------------------------------------#
s7Connection:
  type: Cybus::Connection
  properties:
    protocol: S7
    connection:
      host: 192.168.10.60
      port: 102
      rack: 0
      slot: 1
      pollInterval: 1000
Code-Sprache: YAML (yaml)
We define that we want to use the Cybus::Connection resource type, which tells Connectware that we want to create a new device connection. To define what kind of connection we want to use, we are specifying the S7 protocol. In order to be able to establish a connection to the device, we need to specify the connection settings as well. Here, we want to connect to our S7 device on the given host IP, port, rack and slot number.
Furthermore, we specified that the pollIntervall for reading the data will be set to one second.
We want to access certain data elements on the PLC to either read data from or write data to the device. Similar to the Connection section of the commissioning file, we define an Endpoint section:
# ----------------------------------------------------------------------------#
# Endpoint Resource - S7 Protocol
# ----------------------------------------------------------------------------#
s7EndpointDB1000:
  type: Cybus::Endpoint
  properties:
    protocol: S7
    connection: !ref s7Connection
    subscribe:
      address: DB10,X0.0
Code-Sprache: YAML (yaml)
We define a specific endpoint, which represents any data element on the device, by using the Cybus::Endpoint resource. Equally to what we have done in the connection section, we have to define the protocol this endpoint is relying on, namely the S7 protocol. Every endpoint needs a connection it belongs to, so we add a reference to the earlier created connection by using !ref followed by the name of the connection resource. Finally, we need to define which access operation we would like to perform on the data element and on which absolute address in memory it is stored at. In this case subscribe is used, which will read the data from the device in the interval defined by the referenced connection resource.
The data element which is to be accessed here is located on data block 10 (DB10) and is a single boolean (X) located on byte 0, bit 0 (0.0). If you wish to learn more on how addressing works for the S7 protocol please refer to our documentation here.
Now that we can access our data-points on the S7 device we want to map them to a meaningful MQTT topic. Therefore we will use the mapping resource. Here is an example:
# ----------------------------------------------------------------------------#
# Mapping Resource - S7 Protocol
# ----------------------------------------------------------------------------#
mapping:
  type: Cybus::Mapping
  properties:
    mappings:
      - subscribe:
          endpoint: !ref s7EndpointDB1000
        publish:
          topic: !sub '${Cybus::MqttRoot}/DB1000'
Code-Sprache: YAML (yaml)
Our mapping example transfers the data from the endpoint to a specified MQTT topic. It is very important to define from what source we want the data to be transferred and to what target. The source is defined by using subscribe and setting endpoint to reference the endpoint mentioned above. The target is defined by using publish and setting the topic to the MQTT topic where we want the data to be published on. Similarly to using !ref in our endpoint, here we use !sub which substitutes the variable within ${} with its corresponding string value.
Adding up the three previous sections, a full commissioning file would look like this:
description: >
  S7 Example

metadata:
  name: S7 Device

resources:
# ----------------------------------------------------------------------------#
# Connection Resource - S7 Protocol
# ----------------------------------------------------------------------------#
  s7Connection:
    type: Cybus::Connection
    properties:
      protocol: S7
      connection:
        host: 192.168.10.60
        port: 102
        rack: 0
        slot: 1
        pollInterval: 1000

# ----------------------------------------------------------------------------#
# Endpoint Resource - S7 Protocol
# ----------------------------------------------------------------------------#
  s7EndpointDB1000:
    type: Cybus::Endpoint
    properties:
      protocol: S7
      connection: !ref s7Connection
      subscribe:
        address: DB10,X0.0

# ----------------------------------------------------------------------------#
# Mapping Resource - S7 Protocol
# ----------------------------------------------------------------------------#
  mapping:
    type: Cybus::Mapping
    properties:
      mappings:
        - subscribe:
            endpoint: !ref s7EndpointDB1000
          publish:
            topic: !sub '${Cybus::MqttRoot}/DB1000'
Code-Sprache: YAML (yaml)Usually we also want to write data to the device. This can easily be accomplished by defining another endpoint where we use write instead of subscribe.
s7EndpointDB1000Write:
  type: Cybus::Endpoint
  properties:
    protocol: S7
    connection: !ref s7Connection
    write:
      address: DB10,X0.0
Code-Sprache: YAML (yaml)
We also append our mappings to transfer any data from a specific topic to the endpoint we just defined.
mapping:
  type: Cybus::Mapping
  properties:
    mappings:
      - subscribe:
          endpoint: !ref s7EndpointDB1000
        publish:
          topic: !sub '${Cybus::MqttRoot}/DB1000'
      - subscribe:
          topic: !sub '${Cybus::MqttRoot}/DB1000/set'
        publish:
          endpoint: !ref s7EndpointDB1000Write
Code-Sprache: YAML (yaml)
To actually write a value, we just have to publish it on the given topic. In our case the topic would be services/s7device/DB1000/set and the message has to look like this:
{
  "value": true
}
Code-Sprache: YAML (yaml)We are finally ready to connect to our Siemens S7 PLC and use it.
In this Cybus Learn article we learned how to connect and use an S7 device on Connectware. See Example Project Repo for the complete Commissioning File. If you want to keep going and get started with connecting your own S7 device with custom addressing, please visit the Reference docs to get to know all the Connectware S7 protocol features.
A good point to go further from here is the Service Basics Lesson, which covers how to use data from your S7 device.
Disclaimer:
Step7, TIA Portal, S7, S7-1200, Sinamics are trademarks of Siemens AG
This guide is to help you connect to an OPC UA server, using Connectware. It assumes that you understand the fundamental Connectware concepts. For that you can check out the Technical Overview. To follow the example, you should have a Connectware instance running. If you don’t have that, learn Installing Cybus Connectware. Although we focus on OPC UA here, you should also be familiar with MQTT. If in doubt, head over to MQTT Basics.
You will learn to integrate OPC UA servers into your Connectware use case. Everything you need to get started will be covered in the following topics:
Service YAMLs used in this lesson are available on GitHub.
Our example utilizes the OPC UA server at opcuaserver.com, because it is publicly available. You can of course bring your own device instead.
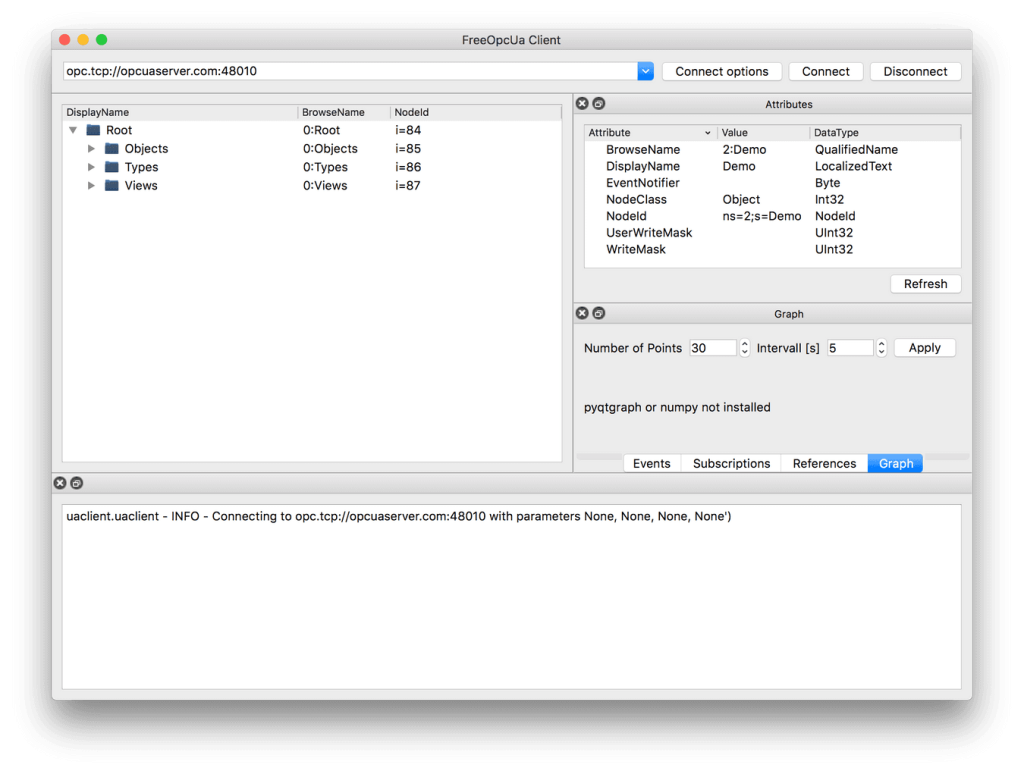
This guide recommends using FreeOpcUa’s Simple OPC UA GUI client for exploration. It is open source and offers convenient installation on Windows, Linux and Mac. If you prefer working on the terminal, go for Etienne Rossignon’s opcua-commander. If you have another option available, you may as well stick to it.
Let’s get started! Launch your OPC UA browser and connect to the endpoint opc.tcp://opcuaserver.com:48010 (or whatever endpoint applies to the device you brought). Tada! – the three root nodes Objects, Types, and Views should show up.
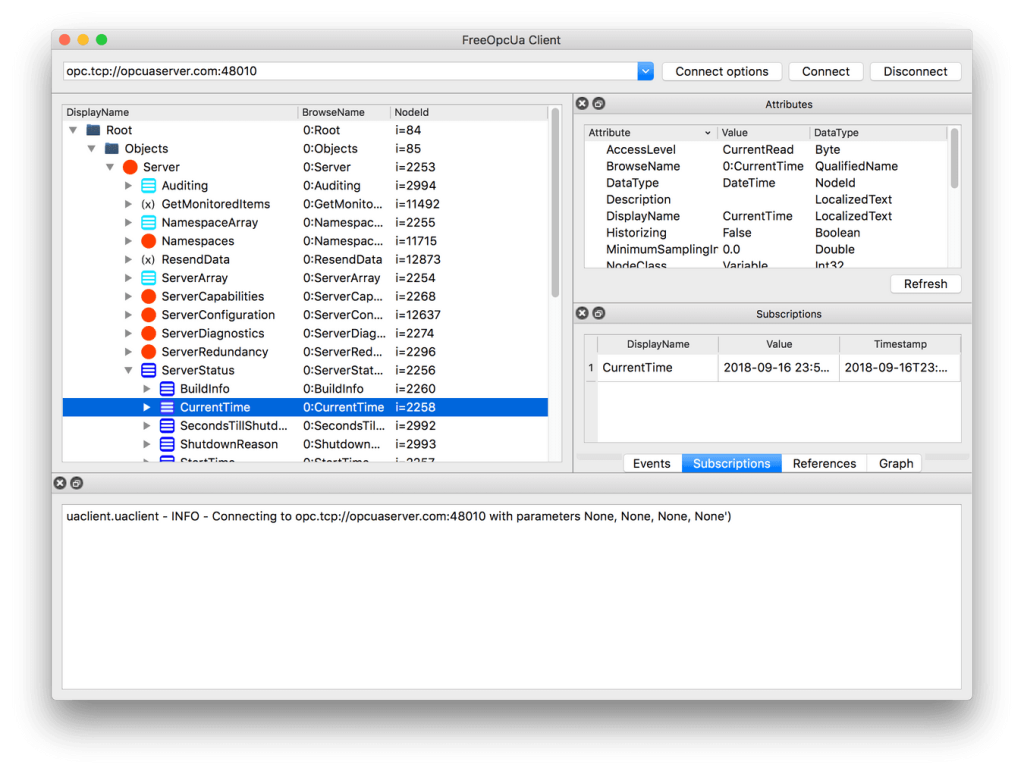
Explore and find the node which is displayed as CurrentTime. Select it and take a look at the Attributes pane – according to the NodeClass attribute we are dealing with a Variable which, by specification, contains a Value attribute. Variable nodes allow us to read and write data, depending on the AccessLevel attribute.
Right click on CurrentTime and select subscribe to data change. The Subscriptions pane then shows the actual value and it is updating at a fast rate.
Now we know that Variable nodes in the OPC UA address space are the datasources, but how to make use of them with Connectware? There are two ways to reference them:
NodeId, which is a node’s unique identifier. For example, the CurrentTime variable’s NodeId is i=2258.BrowsePath, which is the path of BrowseName when you navigate the treeview. For example, the CurrentTime variable’s BrowsePath assembles to /0:Objects/0:Server/0:ServerStatus/0:CurrentTime.Both approaches have their pros and cons. In general, the NodeId is less clumsy, but less descriptive. In this example, we prefer the NodeId and recreate the tree structure semantics with the help of MQTT mappings.
Below, there is a table of variables to use in the example. Most variables are read-only, except for the Temperature Setpoint, which allows us to actually control something.
|Variable             |NodeId                                      |BrowsePath                                                               |AccessLevel              |
|–––––––––––––––––––––|––––––––––––––––––––––––––––––––––––––––––––|–––––––––––––––––––––––––––––––––––––––––––––––––––––––––––––––––––––––––|–––––––––––––––––––––––––|
|CurrentTime          |i=2258                                      |/0:Objects/0:Server/0:ServerStatus/0:CurrentTime                         |CurrentRead              |
|Humidity             |ns=3;s=AirConditioner_1.Humidity            |/0:Objects/3:BuildingAutomation/3:AirConditioner_1/3:Humidity            |CurrentRead              |
|Power Consumption    |ns=3;s=AirConditioner_1.PowerConsumption    |/0:Objects/3:BuildingAutomation/3:AirConditioner_1/3:PowerConsumption    |CurrentRead              |
|Temperature          |ns=3;s=AirConditioner_1.Temperature         |/0:Objects/3:BuildingAutomation/3:AirConditioner_1/3:Temperature         |CurrentRead              |
|Temperature Setpoint |ns=3;s=AirConditioner_1.TemperatureSetPoint |/0:Objects/3:BuildingAutomation/3:AirConditioner_1/3:TemperatureSetPoint |CurrentRead, CurrentWrite|
Code-Sprache: YAML (yaml)The Service YAML is used to specify connections, endpoints and mappings for Connectware to handle. Create a new file in a text editor, e.g. opcua-example-service.yml. This example adds minimal content, to not distract the eye. For a complete reference of properties you can check out the Structure of the commissioning file.
These contain some general information. You can give a short description and add a stack of metadata. Regarding the metadata, only the name is required while the rest is optional. We will just use the following set of information for this lesson:
description: >
 OPC UA Example Service
 Cybus Knowledge Base - How to connect an OPC UA server

metadata:
 name: OPC UA Example Service
Code-Sprache: YAML (yaml)
Parameters can be adjusted in the Connectware Web UI. We are defining the address details of our OPC UA server as parameters, so they are used as default, but can be customized in case we want to connect to a different server.
parameters:

 opcuaHost:
   type: string
   description: OPC UA Host Address
   default: opcuaserver.com

 opcuaPort:
   type: integer
   description: OPC UA Host Port
   default: 48010
Code-Sprache: YAML (yaml)The first resource we need is a connection to the OPC UA server.
opcuaConnection:
   type: Cybus::Connection
   properties:
     protocol: Opcua
     connection:
       host: !ref opcuaHost
       port: !ref opcuaPort
       #username: myUsername
       #password: myPassword
Code-Sprache: YAML (yaml)
If you are using a username and password, you could also create parameters, to make them configurable. In our case the server does not require credentials.
  currentTime:
   type: Cybus::Endpoint
   properties:
     protocol: Opcua
     connection: !ref opcuaConnection
     topic: server/status/currenttime
     subscribe:
       nodeId: i=2258


 Humidity:
   type: Cybus::Endpoint
   properties:
     protocol: Opcua
     connection: !ref opcuaConnection
     topic: building-automation/airconditioner/1/humidity
     subscribe:
       nodeId: ns=3;s=AirConditioner_1.Humidity
       #browsePath: /0:Objects/3:BuildingAutomation/3:AirConditioner_1/3:Humidity

 PowerConsumption:
   type: Cybus::Endpoint
   properties:
     protocol: Opcua
     connection: !ref opcuaConnection
     topic: building-automation/airconditioner/1/power-consumption
     subscribe:
       nodeId: ns=3;s=AirConditioner_1.PowerConsumption

 Temperature:
   type: Cybus::Endpoint
   properties:
     protocol: Opcua
     connection: !ref opcuaConnection
     topic: building-automation/airconditioner/1/temperature
     subscribe:
       nodeId: ns=3;s=AirConditioner_1.Temperature

 TemperatureSetpointSub:
   type: Cybus::Endpoint
   properties:
     protocol: Opcua
     connection: !ref opcuaConnection
     topic: building-automation/airconditioner/1/temperature-setpoint
     subscribe:
       nodeId: ns=3;s=AirConditioner_1.TemperatureSetPoint


 TemperatureSetpointWrite:
   type: Cybus::Endpoint
   properties:
     protocol: Opcua
     connection: !ref opcuaConnection
     topic: building-automation/airconditioner/1/temperature-setpoint
     write:
       nodeId: ns=3;s=AirConditioner_1.TemperatureSetPoint
       #browsePath: /0:Objects/3:BuildingAutomation/3:AirConditioner_1/3:TemperatureSetPoint
Code-Sprache: YAML (yaml)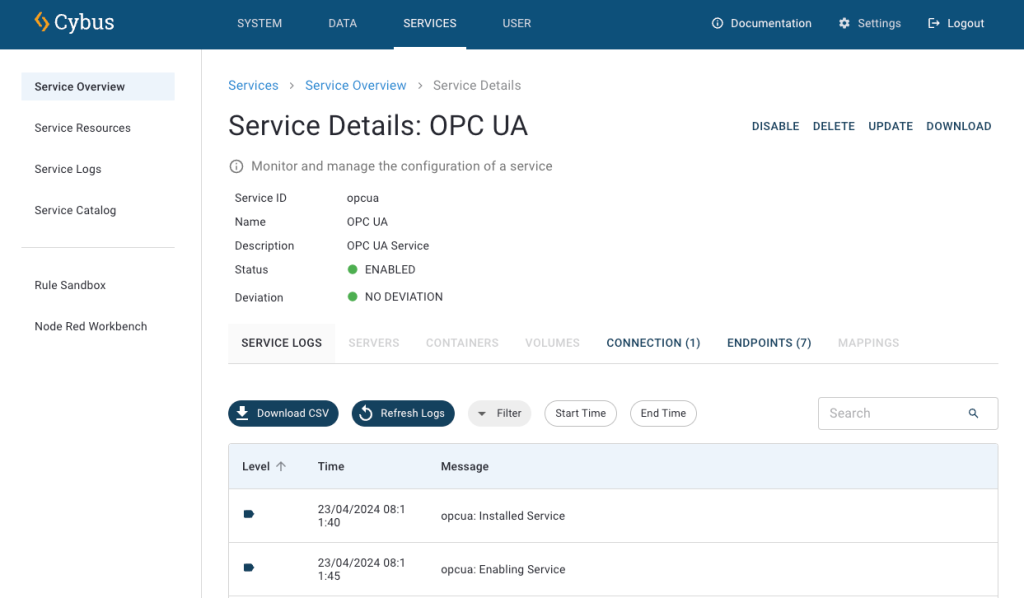
To see the incoming data, click Data on the navigation panel. In the Data Explorer list, you can see the MQTT topic we specified in the commissioning file. To see data from a specific topic/endpoint, navigate to the corresponding topic in Available Topics list. This makes Connectware subscribe to topic and display its values on the Monitored Topics. In the History section on the bottom right, you will find all the data received since you subscribed to the topics.
First, we used an OPC UA client application to browse the address space. This allowed us to pick the variables of our interest and to reference them by their NodeId, or by BrowsePath. Given that information, we created a Service YAML and installed the Service on Connectware. In the Explorer we finally saw the live data on corresponding MQTT topics and are now ready to go further with our OPC UA integration.
Why not store the OPC UA data in a time series database and display it on a dashboard for instance?
This lesson assumes that you want to integrate the Modbus/TCP protocol with Cybus Connectware. To understand the basic concepts of Connectware, please check out the Technical Overview lesson. To follow along with the example, you will also need a running instance of Connectware. If you don’t have that, learn How to install Connectware. Although we focus on Modbus/TCP here, we will ultimately access all data via MQTT. So you should also be familiar with MQTT. If in doubt, head over to our MQTT Basics lesson.
This article will teach you the integration of Modbus/TCP servers. In more detail, the following topics are covered:
The Commissioning Files used in this lesson are made available in the Example Files Repository on GitHub.
For this example we presume that we have a device of the type Janitza UMG 604-EP PRO installed on our Ethernet network. This is a device for measuring and analyzing the electric power quality, which is equipped with a Modbus/TCP server.
This device offers a lot of power analysis data you can access via Modbus, ranging over some thousands of address points. Although there is such a lot of interesting data, we assume that we just want to know the actual day of month, which is also provided and the real powers of L1-L3 as well as the utility frequency. Examining the Modbus address-list for UMG 604-PRO, we find the following addresses representing the date and time:
| Address | Format | Designation | Unit | Remarks                    |
|---------|--------|-------------|------|----------------------------|
| 0       | long64 | _REALTIME   | 2 ns | Time (UTC)                 |
| 4       | int    | _SYSTIME    | sec  | Time (UTC)                 |
| 6       | short  | _DAY        |      | Day (1 .. 31)              |
| 7       | short  | _MONTH      |      | Month (0=Jan, .. 11=Dec)   |
| 8       | short  | _YEAR       |      | Year                       |
| 9       | short  | _HOUR       | h    | Hour (1 .. 24)             |
| 10      | short  | _MIN        | min  | Minute (1 .. 59)           |
| 11      | short  | _SEC        | s    | Second (1 .. 59)           |
| 12      | short  | _WEEKDAY    |      | Weekday , (0=Sun .. 6=Sat) |
Code-Sprache: YAML (yaml)
We also find the following addresses representing frequently required readings:
| Address | Format | Designation   | Unit | Remarks                               |
|---------|--------|---------------|------|---------------------------------------|
| 19000   | float  | _G_ULN[0]     | V    | Voltage L1-N                          |
| 19002   | float  | _G_ULN[1]     | V    | Voltage L2-N                          |
| 19004   | float  | _G_ULN[2]     | V    | Voltage L3-N                          |
| 19006   | float  | _G_ULL[0]     | V    | Voltage L1-L2                         |
| 19008   | float  | _G_ULL[1]     | V    | Voltage L2-L3                         |
| 19010   | float  | _G_ULL[2]     | V    | Voltage L3-L1                         |
| 19012   | float  | _G_ILN[0]     | A    | Apparent current, L1-N                |
| 19014   | float  | _G_ILN[1]     | A    | Apparent current, L2-N                |
| 19016   | float  | _G_ILN[2]     | A    | Apparent current, L3-N                |
| 19018   | float  | _G_I_SUM3     | A    | Vector sum; IN=I1+I2+I3               |
| 19020   | float  | _G_PLN[0]     | W    | Real power L1-N                       |
| 19022   | float  | _G_PLN[1]     | W    | Real power L2-N                       |
| 19024   | float  | _G_PLN[2]     | W    | Real power L3-N                       |
| 19026   | float  | _G_P_SUM3     | W    | Psum3=P1+P2+P3                        |
| 19028   | float  | _G_SLN[0]     | VA   | Apparent power L1-N                   |
| 19030   | float  | _G_SLN[1]     | VA   | Apparent power L2-N                   |
| 19032   | float  | _G_SLN[2]     | VA   | Apparent power L3-N                   |
| 19034   | float  | _G_S_SUM3     | VA   | Sum; Ssum3=S1+S2+S3                   |
| 19036   | float  | _G_QLN[0]     | var  | Reactive power L1 (fundamental comp.) |
| 19038   | float  | _G_QLN[1]     | var  | Reactive power L2 (fundamental comp.) |
| 19040   | float  | _G_QLN[2]     | var  | Reactive power L3 (fundamental comp.) |
| 19042   | float  | _G_Q_SUM3     | var  | Qsum3=Q1+Q2+Q3 (fundamental comp.)    |
| 19044   | float  | _G_COS_PHI[0] | -    | CosPhi; UL1 IL1 (fundamental comp.)   |
| 19046   | float  | _G_COS_PHI[1] | -    | CosPhi; UL2 IL2 (fundamental comp.)   |
| 19048   | float  | _G_COS_PHI[2] | -    | CosPhi; UL3 IL3 (fundamental comp.)   |
| 19050   | float  | _G_FREQ       | Hz   | Measured frequency                    |
Code-Sprache: YAML (yaml)
In the documentation there is also a table defining the size and range of the terms used in the column Format, which we will need for specifying our endpoints.
| Type   | Size   | Minimum  | Maximum  |
|--------|--------|----------|----------|
| char   | 8 bit  | 0        | 255      |
| byte   | 8 bit  | -128     | 127      |
| short  | 16 bit | -2^15    | 2^15-1   |
| int    | 32 bit | -2^31    | 2^31-1   |
| uint   | 32 bit | 0        | 2^32-1   |
| long64 | 64 bit | -2^63    | 2^63-1   |
| float  | 32 bit | IEEE 754 | IEEE 754 |
| double | 64 bit | IEEE 754 | IEEE 754 |
Code-Sprache: YAML (yaml)The Commissioning File is a set of parameters which describes the resources that are necessary to collect and provide all the data for our application. It contains information about all connections, data endpoints and mappings and is read by Connectware. To understand the file’s anatomy in detail, please consult the Reference docs. To get started, open a text editor and create a new file, e.g. modbus-example-commissioning-file.yml. The Commissioning File is in the YAML format, perfectly readable for human and machine! We will now go through the process of defining the required sections for this example:
These sections contain more general information about the commissioning file. You can give a short description and add a stack of metadata. Regarding the metadata, only the name is required while the rest is optional. We will just use the following set of information for this lesson:
description: >

  Modbus/TCP Example Commissioning File
  Cybus Learn - How to connect and integrate an Modbus/TCP server
  https://learn.cybus.io/lessons/XXX/

metadata:

  name: Modbus/TCP Example Commissioning File
  version: 1.0.0
  icon: https://www.cybus.io/wp-content/uploads/2019/03/Cybus-logo-Claim-lang.svg
  provider: cybus
  homepage: https://www.cybus.io
Code-Sprache: YAML (yaml)
Parameters allow the user to customize Commissioning Files for multiple use cases by referring to them from within the Commissioning File. Each time a Commissioning File is applied or reconfigured in Connectware, the user is asked to enter custom values for the parameters or to confirm the default values.
parameters:

  modbusHost:
    type: string
    description: Modbus/TCP Host
    default: 192.168.123.123

  modbusPort:
    type: integer
    default: 502
Code-Sprache: YAML (yaml)
We are defining the host address details of our Modbus/TCP server as parameters, so they are used as default but can be customized in case we want to connect to a different server.
In the resources section we declare every resource that is needed for our application. The first resource we need is a connection to the Modbus/TCP server.
resources:

  modbusConnection:
    type: Cybus::Connection
    properties:
      protocol: Modbus
      connection:
        host: !ref modbusHost
        port: !ref modbusPort
Code-Sprache: YAML (yaml)
After giving our resource a name – for the connection it is modbusConnection – we define the type of the resource and its type-specific properties. In case of Cybus::Connection we declare which protocol and connection parameters we want to use. For details about the different resource types and available protocols, please consult the Reference docs. For the definition of our connection we reference the earlier declared parameters modbusHost and modbusPort by using !ref.
The next resources needed are the data points that we have selected earlier. Let’s add those by extending our list of resources with some endpoints.
  dayOfMonth:
    type: Cybus::Endpoint
    properties:
      protocol: Modbus
      connection: !ref modbusConnection
      subscribe:
        fc: 3
        length: 1
        interval: 2000
        address: 6
        dataType: int16BE

  realPowerL1:
    type: Cybus::Endpoint
    properties:
      protocol: Modbus
      connection: !ref modbusConnection
      subscribe:
        fc: 3
        length: 2
        interval: 2000
        address: 19020
        dataType: floatBE

  realPowerL2:
    type: Cybus::Endpoint
    properties:
      protocol: Modbus
      connection: !ref modbusConnection
      subscribe:
        fc: 3
        length: 2
        interval: 2000
        address: 19022
        dataType: floatBE

  realPowerL3:
    type: Cybus::Endpoint
    properties:
      protocol: Modbus
      connection: !ref modbusConnection
      subscribe:
        fc: 3
        length: 2
        interval: 2000
        address: 19024
        dataType: floatBE

  frequency:
    type: Cybus::Endpoint
    properties:
      protocol: Modbus
      connection: !ref modbusConnection
      subscribe:
        fc: 3
        length: 2
        interval: 2000
        address: 19050
        dataType: floatBE
Code-Sprache: YAML (yaml)
Each resource of the type Cybus::Endpoint needs a definition of the used protocol and on which connection it is rooted. Here you can easily refer to the previously declared connection by using its name. Furthermore we have to define which Modbus address the endpoint should read from or write to by giving the function code fc, the length , the interval, the address and the dataType.
The function code fc defines the operation of the request. To learn more about the different codes and their purpose, you can consult one of many sources on the web, e.g. Simply Modbus. However, the exact implementation of the function codes may vary from manufacturer to manufacturer and is in some sources described as „artistic freedom“ in designing their modbus devices. Which function code to use on which data is therefore also depending on your device and its structure of register addressing, so also check out the documentation of your device. For the device we utilize in this example, we can either use function code 3 or 4 to read the analogue values, so we just use 3.
The length describes how many registers should be read starting at the specified address. The registers of a modbus device have a length of 16 bits. Assuming we want to read the value of day of month, which is given in the format „short“, we learn from the table defining the actual size of the formats, it has a size of 16 bits and therefore a length of one register, so we define the property length as 1. For the other endpoints we define the length as 2, since the format „float“ is 32 bits long, using two registers.
Optionally, we can define the poll interval in milliseconds, defining how frequently a value is requested from the server, which is 1000 ms by default. To reduce the bandwidth demand we set the interval of our endpoints to 2000 ms.
We looked at the modbus address list of the device before and found the datapoints representing the day of month on address 6 and the readings of real power L1-L3 on addresses 19020,19022 and 19024 and the frequency on address 19050.
The property dataType is optional, but in fact you will get a buffer value in case you do not specify the data type explicitly, which at first you would have to parse yourself. To avoid this, we define the data types for the power values and frequency as floatBE, since from the address list we learned, those were in the format „float“ and the section „Byte sequence“ of this document gives us the information „The addresses described in this address list supply the data in the „Big-Endian“ format.“, which „BE“ stands for.
Looking at the endpoint „dayOfMonth“ we see, the format of its address is „short“, which corresponding to the table of formats matches the size and range of a 16-bit integer data type. Following this, we define the data type of the endpoint „dayOfMonth“ as int16BE. You can find all available data types for Modbus in the Reference docs.
To this point we are already able to read values from the Modbus/TCP server and monitor them in the Connectware Explorer or on the default MQTT topics related to our service. To achieve a data flow that would satisfy the requirements of our integration purpose, we may need to add a mapping resource to publish the data on topics corresponding to our MQTT topic structure.
  mapping:
    type: Cybus::Mapping
    properties:
      mappings:
        - subscribe:
            endpoint: !ref dayOfMonth
          publish:
            topic: 'janitza/status/day'
        - subscribe:
            endpoint: !ref realPowerL1
          publish:
            topic: 'janitza/measurement/realpower/1'
        - subscribe:
            endpoint: !ref realPowerL2
          publish:
            topic: 'janitza/measurement/realpower/2'
        - subscribe:
            endpoint: !ref realPowerL3
          publish:
            topic: 'janitza/measurement/realpower/3'
        - subscribe:
            endpoint: !ref frequency
          publish:
            topic: 'janitza/measurement/frequency'
Code-Sprache: YAML (yaml)
In this case the mapping defines which endpoints value is published on which MQTT topic. In case you want to perform a write operation to your device, you simply have to reverse the data flow and map it from the MQTT topic to the according endpoint like this:
  - subscribe:
      topic: 'janitza/control/setvalue'
    publish:
      endpoint: !ref valueToSetCode-Sprache: YAML (yaml)
Then you can write to the endpoint by simply publishing on this MQTT topic. Please note that write messages have to be in JSON format containing the value as follows:
{
  "value": true
}Code-Sprache: YAML (yaml)
This message has the obligatory key „value“, which can contain a value of any data type (which should match the concerning endpoint): For instance boolean values just use true/false, integers are represented by themselves like 3, decimals similarly appear as 10.45 and strings are written in "quotes".
You now have the Commissioning File ready for installation. Head over to the Services tab in the Connectware Admin UI and hit the (+) button to select upload the Commissioning File. You will be asked to specify values for each member of the section parameters or confirm the default values. With a proper written Commissioning File, the confirmation of this dialog will result in the installation of a Service, which manages all the resources we just defined: The connection to the Modbus/TCP server, the endpoints collecting data from the server and the mapping controlling where we can access this data. After enabling this Service you are good to go on and see if everything works out!
Now that we have a connection established between the Modbus/TCP server and Connectware, we can go to the Explorer view, where we see the tree structure of our newly created data points.
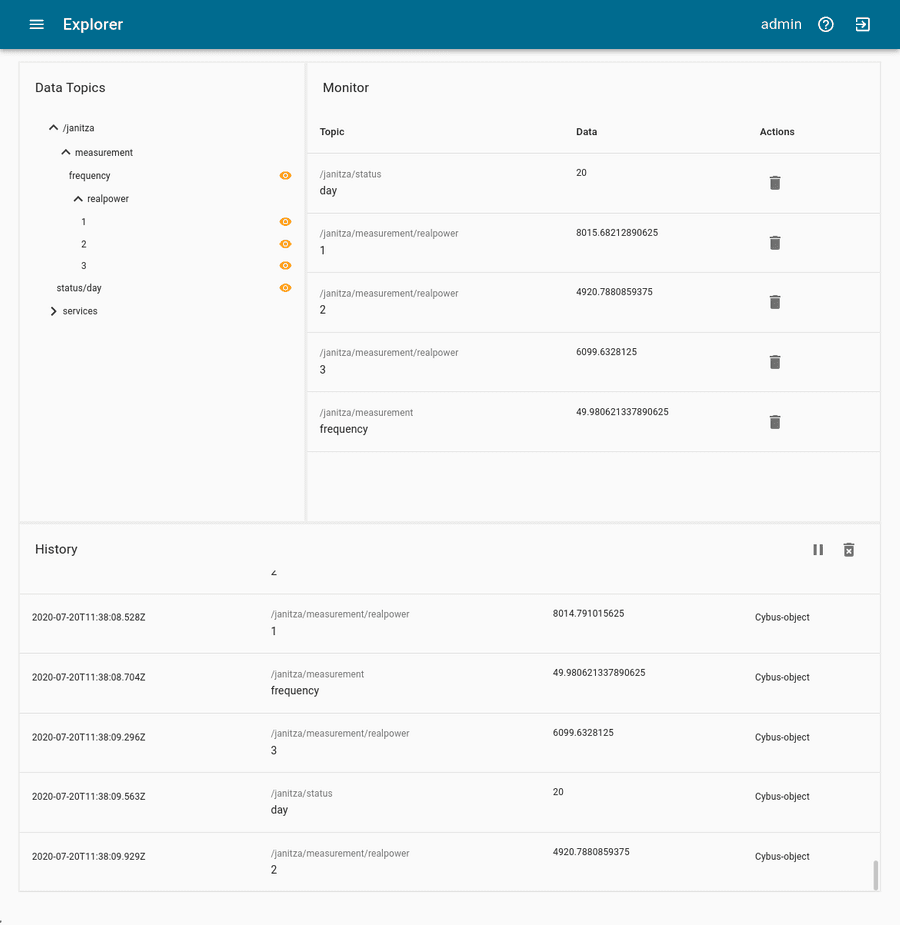
On MQTT topics the data is provided in JSON format containing a timestamp and a value key of which the value represents the data as received from the device:
{
  "value":"2020-07-14T11:43:06.632Z",
  "timestamp":1594726986632
}
Code-Sprache: YAML (yaml)Summarizing this lesson, at first we learned how to identify addresses of the desired data points in the address list of our device along with definitions and conventions about their representation. Given that information, we created a Commissioning File and installed the Service on Connectware. In the Explorer we finally saw the live data on corresponding MQTT topics and are now ready to go further with our Modbus integration.
Connectware offers powerful features to build and deploy applications for gathering, filtering, forwarding, monitoring, displaying, buffering, and all kinds of processing data… why not build a dashboard for instance? For guides check out more of Cybus Learn.
This lesson requires basic knowledge of
Cybus Connectware is a general and extensible on-premise data gateway that connects different devices, provides data for local systems and cloud based backends and makes data exchange transparent and secure. The components of Connectware include a data broker, protocol adapters for connectivity to standard industry protocols, a management and security layer, as well as a runtime environment to include third-party applications.
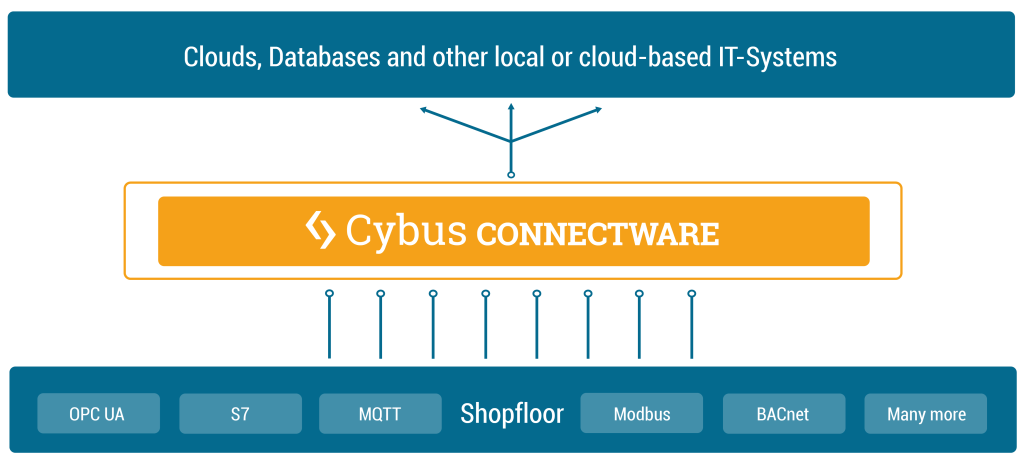
Connectware connects to the different endpoints by dedicated connectors (e.g. OPC UA, Modbus-TCP) that run as part of the Protocol Mapper in Connectware. By its microservice and API architecture Connectware supports the option of adding more connectors. And being a modern enterprise-grade IT solution based on Docker, Connectware is suitable to run on either a data centre infrastructure or standalone computers.
To begin, we’ll provide an introduction to Connectware’s architecture and its constituent parts. Connectware employs a microservice approach, with individual modules functioning in concert to establish a microservice cluster – namely, Cybus Connectware. Microservices offer numerous advantages, such as flexible scalability for individual modules or the entire application, as well as the capacity to integrate third-party applications, various databases, and even disparate programming languages into a unified application.
In the following we will explore the Connectware architecture more closely and see what the individual microservices do and when they come into play, when we are using Connectware. We will start with a heterogene shopfloor full of data and a cloud to which we want to forward our data to – but no means of a connection between them. So the question is how are we transferring our data out of the factory, into the cloud, in a controllable, extendible and secure way?
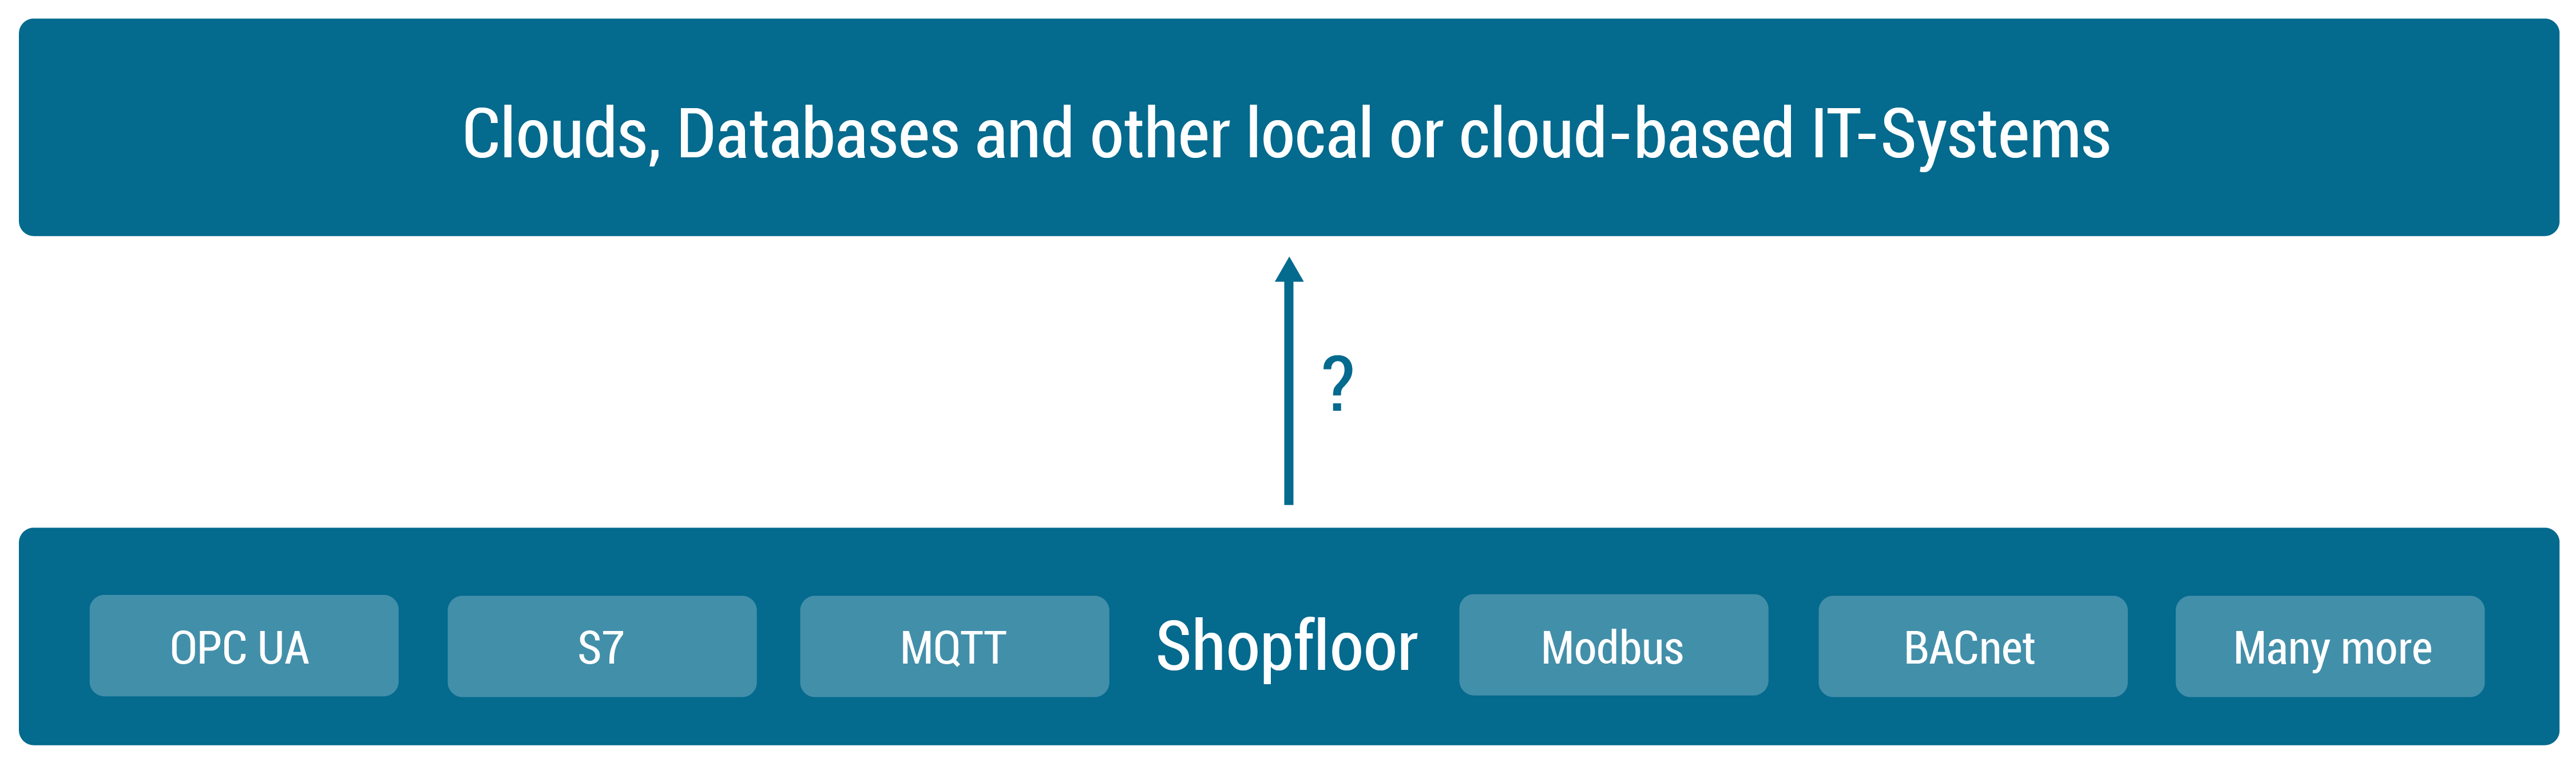
First of all we need to start by establishing a connection between our shopfloor and the cloud application. See the following image to get an overview over the components that we will add in this section to achieve this goal.
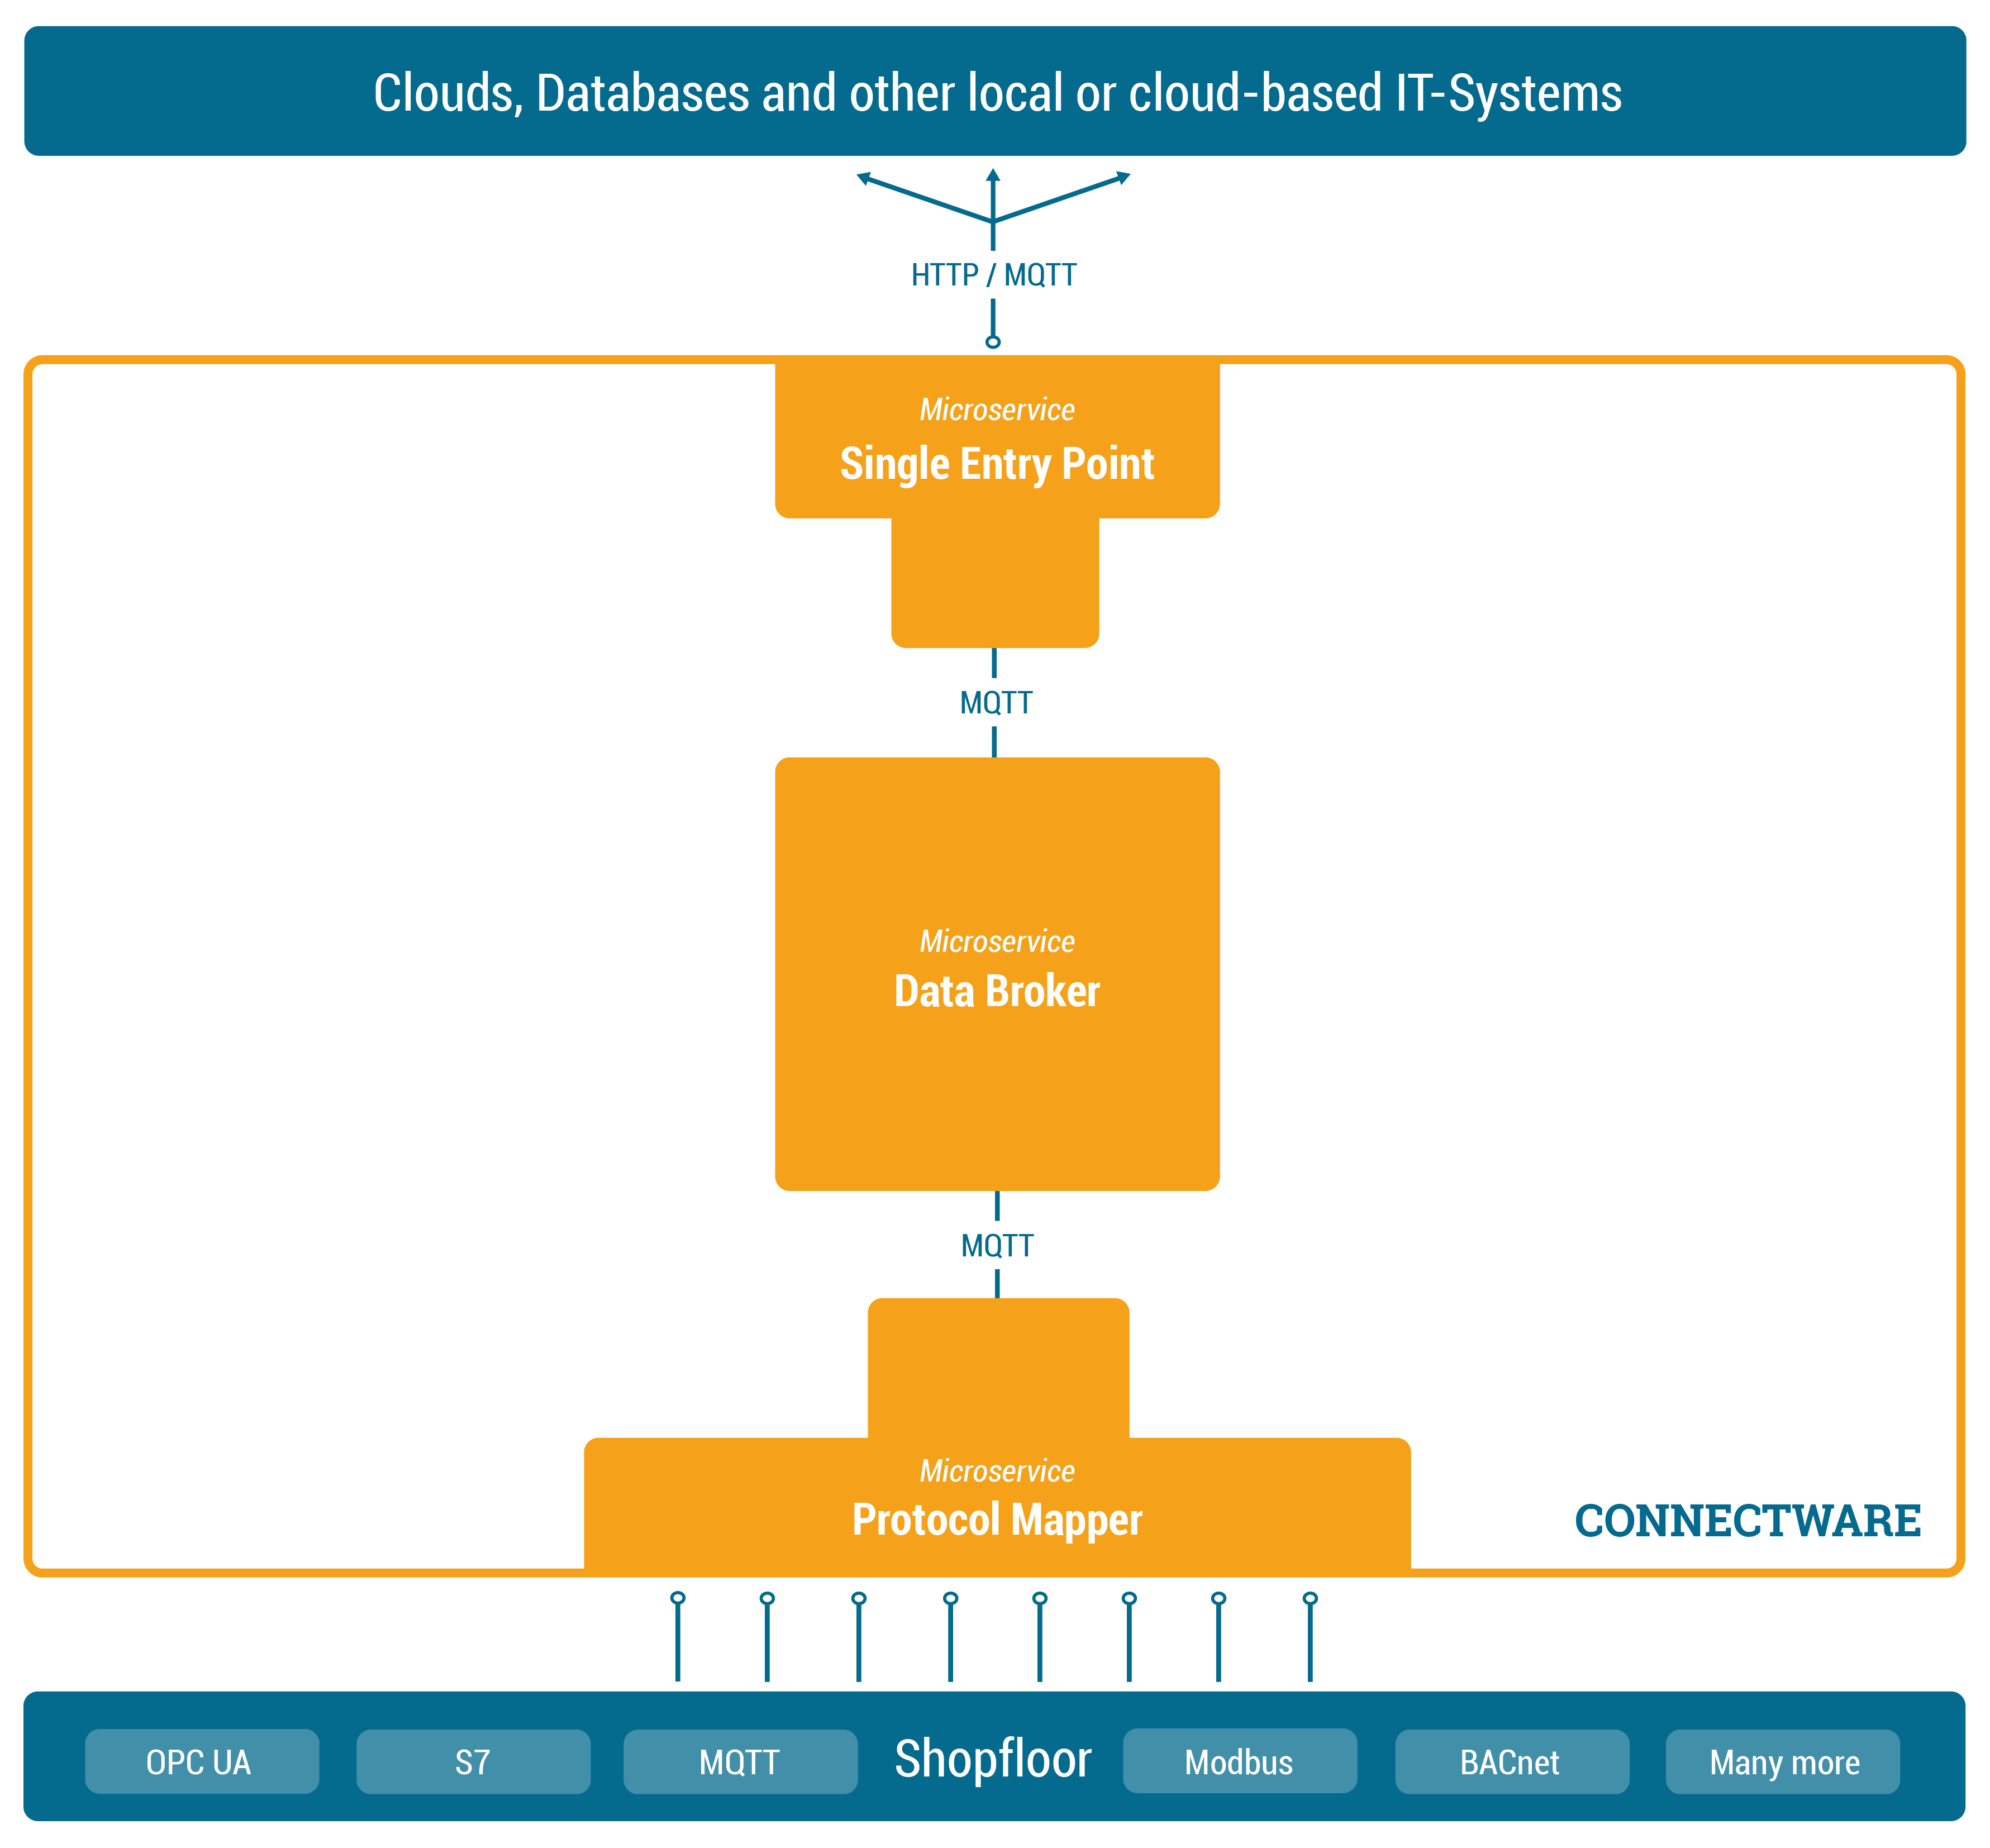
In order to manage and use any of our data, we need to add one central place to Connectware in which we can easily access the data – we could call it a data focal point. This single data hub gives us easy access as well as easy control over all data since all data needs to pass through this central hub. Of course this also means we need to have a Data Broker that is stable, maintainable, scalable, reliable and secure. Further we need to choose a transmission protocol that is widely used and accepted and able to handle large data flows.
The solution is to use MQTT, a standard, lightweight publish-subscribe messaging protocol on top of TCP/IP that is widely used in IoT and industrial applications. Connectware uses a high-performance MQTT broker which scales horizontally and vertically to support a high number of concurrent publishers and subscribers while maintaining low latency and fault tolerance.
So the MQTT Data Broker is the central data hub through which all data passes. Let’s now start connecting our shopfloor to the Data Broker.
How do we get our data from different machines talking different protocols to the Connectware Data Broker? That’s where the Protocol Mapper comes into play. The Protocol Mapper uses a mapping scheme that translates various protocols to a unified MQTT/JSON API and handles the device connection management. Each device is represented by a connection resource which contains endpoints and mappings, which are used to model a MQTT topic hierarchy. All resources are defined in a text-based, human and machine readable YAML file called Commissioning File. To learn more about the configuration of connections see the How to connect to an OPC-UA server article.
Now the MQTT Data Broker is fed directly by our devices from the shopfloor via the Protocol Mapper. The next step is to forward the data to our application.
Connectware, which is running on-premise, needs to forward data to local as well as cloud applications. Therefore we need to have an access point through which Connectware can talk to the outside. Here again, it is a good practice to have one place that all the data needs to pass instead of multiple open connections that all need to be monitored. Connectware provides a Single Entry Point (or more technical Reverse Proxy) which bundles all incoming connections. Thus, to the outside the Entry Point abstracts the different microservices to one single access point. The same applies to the microservices from inside Connectware that only need to know one point to talk to when wanting to connect to the outside and forward data. Using a dedicated and high performance Reverse Proxy one can easily control all connections at this point, making a secure internet access easily possible.
At this point we are collecting data from our shopfloor and are able to forward this data to applications outside of Connectware. Connectware itself however is very well capable of applying logic to the data before forwarding it. Preprocessing the data directly on-premise and for example cutting out sensitive information, enriching data by combining data from different sources or aggregating data and send them as in one burst message to reduce costs for cloud services are just a few use-cases the Rule Engine can be used for.
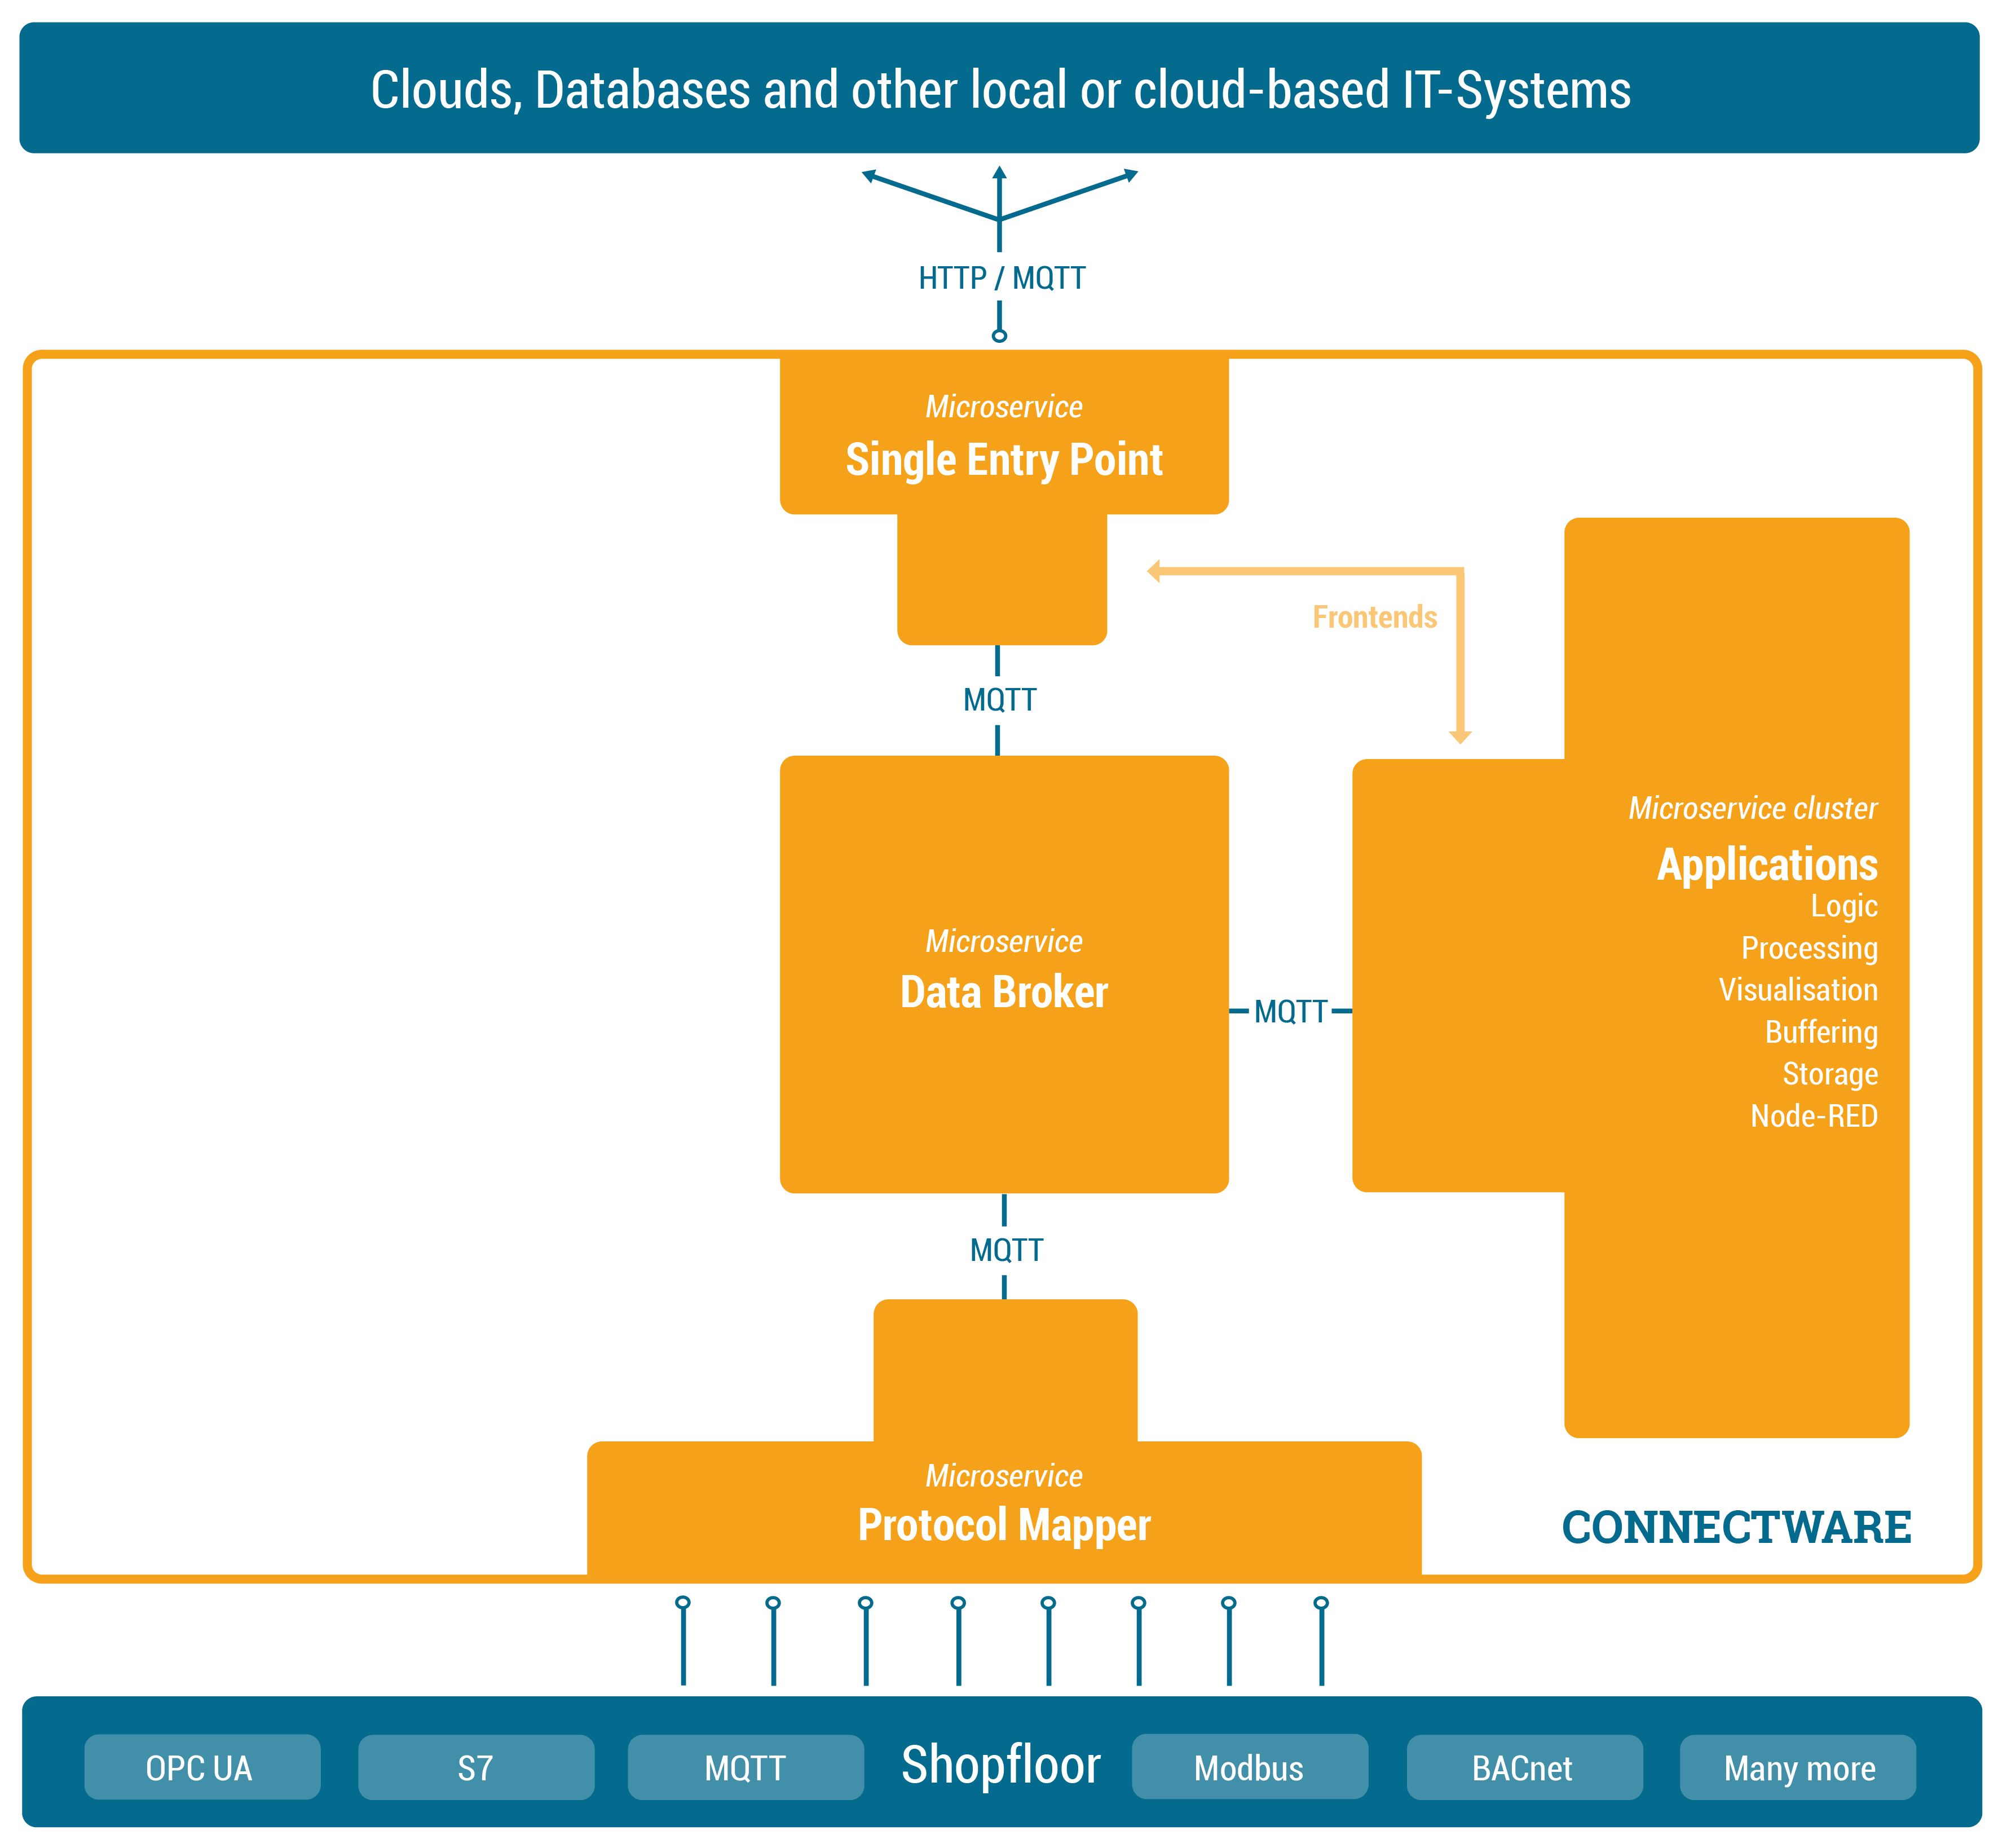
While Connectware allows to individually perform all settings (like managing grantees, setting permissions, starting containerized applications, etc.) the idea of Services is to bundle all these activities into a single point of configuration and execution. Services are usually built for a specific task and context. They bundle required resources with user/permission management in a easy to handle and shareable package.
The Service configuration is done via a Commissioning File – a YAML based text file. The installation process is simply done by feeding the Commissioning File to Connectware, upon this action Connectware will review and display all the configurations that the specific Service wants to create or consume and one can decide whether or not to grant this permission to the Service (think Google Maps wants to know your location). If all permissions are agreed to then the Service will be deployed. This practice puts you in charge of your data and keeps sensitive data from leaving the factory borders.
Services can have a wide variety of different uses on Connectware, from data storage, preprocessing and applying logic to data on-premise prior to e.g. forwarding it to external applications. Services can also serve front-ends (visualizations, dashboards, etc) that can be used to access and control Services from the outside.
To learn more about the configuration and usage of Services see the Service Basics lesson.
We are now very far in our journey of getting data out of our shopfloor. We have a Data Broker which is able to receive and forward shopfloor data and we have a runtime in which we can individually process the data. Now let’s add management and security to it.
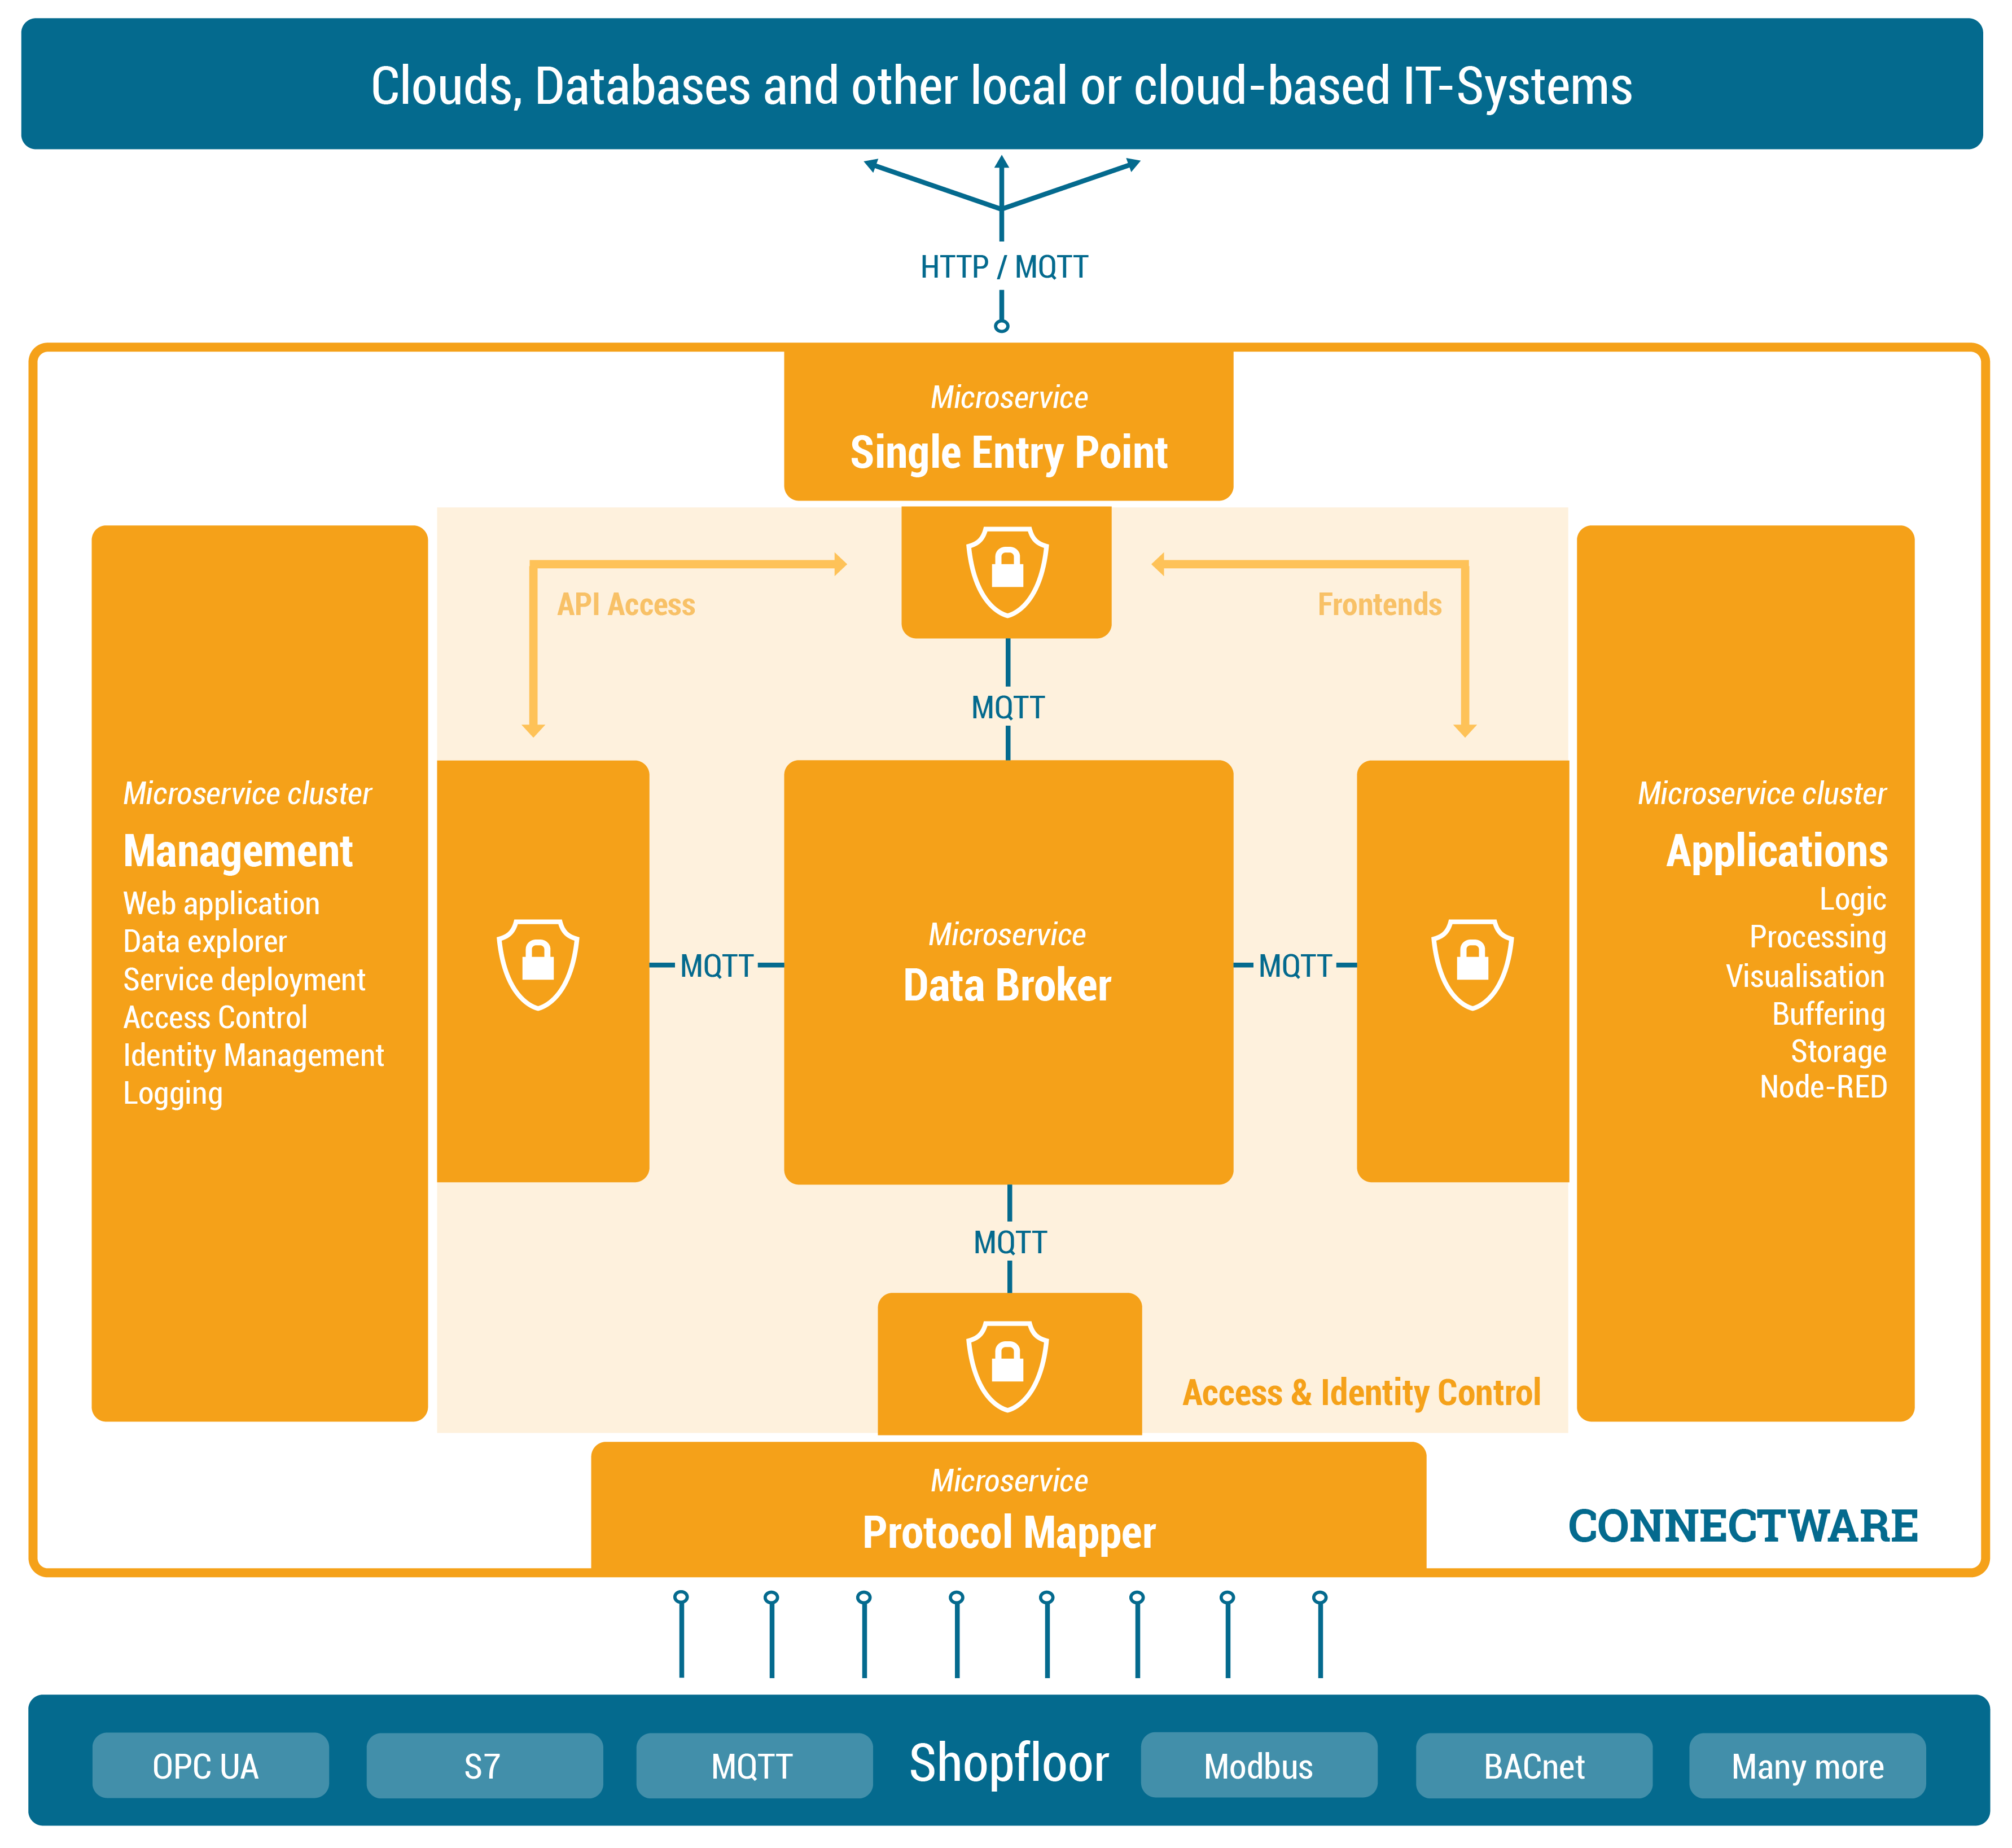
The Management Cluster is concerned with managing Connectware by providing the following:
Managing Connectware is done through a modern web application through which the entire software can be configured. Here you can manage users and services through a graphical user interface. All features of the web interface can also be accessed through a REST API.
Once a client is ready to read or write data tasks like client authentication (through tokens, certificates and pre-shared passwords) and access control (who is allowed to read and write to what) are handled here. Access control is established via a simple, yet powerful control layer that handles read and write access on API endpoints and on the MQTT data broker. If required identity management can also be coupled here to directory services like Active Directory.
Connectware also has logging functionality for all system components and Service applications events. The logs can be viewed and queried via the web application. The log messages can also easily be integrated into external log management systems like ElasticSearch or Splunk.
This article covered a more technical introduction into the different microservices that build up Connectware. Starting with Connectwares scalable MQTT data broker and the Protocol Mapper which maps different industry protocol to specified MQTT topics in a standardised JSON format. Over the Rule Engine that allows complex data transformations, enriching data by combining different sources and buffering capabilities. To how we can secure and manage all of it with the Single Entry Point and the Management Cluster.
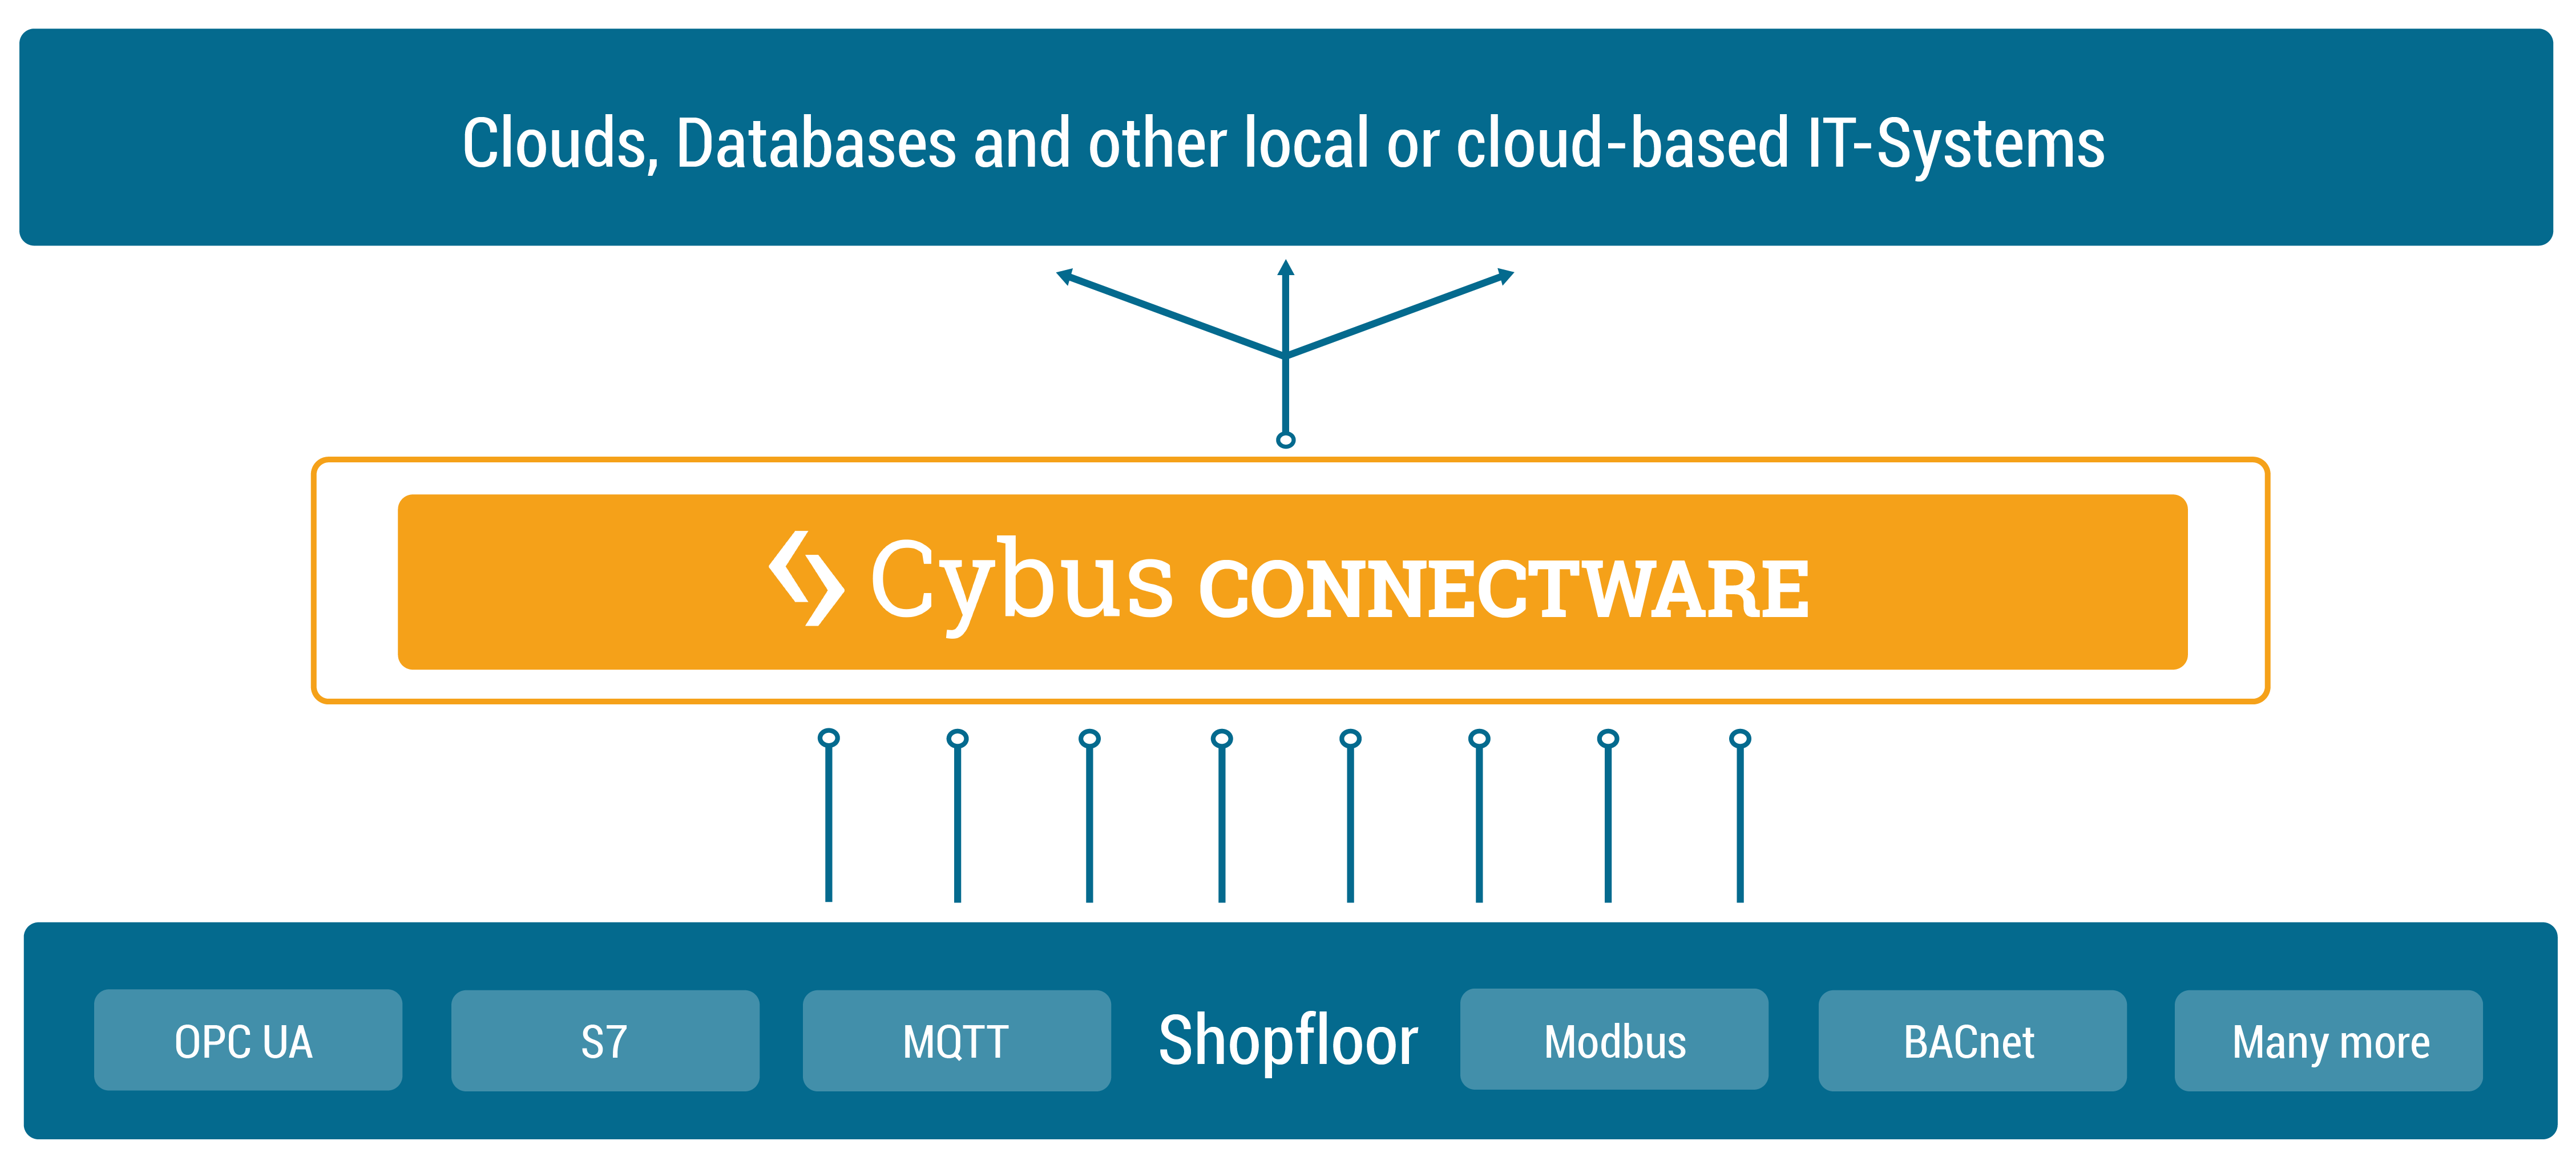
This lesson gave overview over the basic Connectware architecture and functionality. In the following lessons we will dive way deeper into Connectware and it’s components, explaining how to connect devices, how to use and build Services yourself and how to manage Connectware. Have a look at the following articles as a starting point:
Sie müssen den Inhalt von reCAPTCHA laden, um das Formular abzuschicken. Bitte beachten Sie, dass dabei Daten mit Drittanbietern ausgetauscht werden.
Mehr InformationenSie sehen gerade einen Platzhalterinhalt von Turnstile. Um auf den eigentlichen Inhalt zuzugreifen, klicken Sie auf die Schaltfläche unten. Bitte beachten Sie, dass dabei Daten an Drittanbieter weitergegeben werden.
Mehr InformationenSie sehen gerade einen Platzhalterinhalt von Facebook. Um auf den eigentlichen Inhalt zuzugreifen, klicken Sie auf die Schaltfläche unten. Bitte beachten Sie, dass dabei Daten an Drittanbieter weitergegeben werden.
Mehr InformationenSie sehen gerade einen Platzhalterinhalt von HubSpot. Um auf den eigentlichen Inhalt zuzugreifen, klicken Sie auf die Schaltfläche unten. Bitte beachten Sie, dass dabei Daten an Drittanbieter weitergegeben werden.
Mehr InformationenSie sehen gerade einen Platzhalterinhalt von Hubspot Meetings. Um auf den eigentlichen Inhalt zuzugreifen, klicken Sie auf die Schaltfläche unten. Bitte beachten Sie, dass dabei Daten an Drittanbieter weitergegeben werden.
Mehr InformationenSie sehen gerade einen Platzhalterinhalt von Instagram. Um auf den eigentlichen Inhalt zuzugreifen, klicken Sie auf die Schaltfläche unten. Bitte beachten Sie, dass dabei Daten an Drittanbieter weitergegeben werden.
Mehr InformationenSie sehen gerade einen Platzhalterinhalt von X. Um auf den eigentlichen Inhalt zuzugreifen, klicken Sie auf die Schaltfläche unten. Bitte beachten Sie, dass dabei Daten an Drittanbieter weitergegeben werden.
Mehr Informationen