-
Use Cases
Industrien
Getting started
-
Insights & Wissen
Für User
Support
Understanding and leveraging the possibilities of Industry 4.0 has become critical to defending hard-fought market positions and proving new leadership in fast evolving manufacturing markets. Currently, six out of ten industrial enterprises in Germany already apply industry 4.0 practices and this tendency is steadily increasing (Bitkom e.V., 2020). For instance, eighty percent of German SMEs are planning or budgeting upcoming IoT projects (PAC Deutschland, 2019). But to enable agile and powerful IIoT-driven business, IT-departments must choose tools that support them as best possible. Most solutions in the market are based on two very different approaches: A No-Code / Low-Code Platform (NC/LC) or Infrastructure as Code (IaC). Each has their own characteristics and lead to very different operational realities for the people responsible for IIoT architectures. Here’s what you need to know to choose what’s best for you.
Before delivering a precise definition of IaC and NC/LC, it is important to take a step back and examine the basic term infrastructure in the IIoT context.
Let’s look at a traditional manufacturing enterprise with two production machines A and B. Each of them has a controller, which is connected to the companies’ networks C and communicates via different protocols D and E. The input data is then used by the different applications F and G to follow specific purposes, e.g. predictive maintenance. This most basic infrastructure already has seven elements. But in reality examples can easily be far more complex and may need to support growing or changing dynamics.
In a NC/LC based IIoT Edge Hub, all components A-G are visually represented and interrelated per drag-and-drop system on a solution design canvas. Each element is typically described via entry fields, check boxes and radio buttons in dedicated configuration windows. Immersing yourself in the code or into seemingly complex configuration files is not required. At the same time, this user convenience limits the deployment to those systems that fit into a graphical representation.
In contrast, the Infrastructure as Code (IaC) approach describes an entire infrastructure, needed for an IIoT use-case, in only one structured text file – often called the configuration or commissioning file. This file lists all of its components, called resources, and defines their specifications and interrelations in a standardized way. The commissioning file thus avoids time-consuming maneuvering of separate configurations or even scripts for each and all the different elements needed in a use-case. Everything is in one place, structured and standardized.
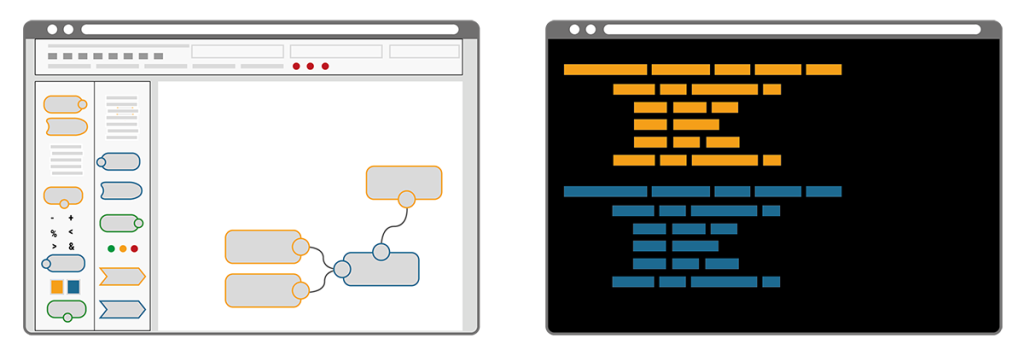
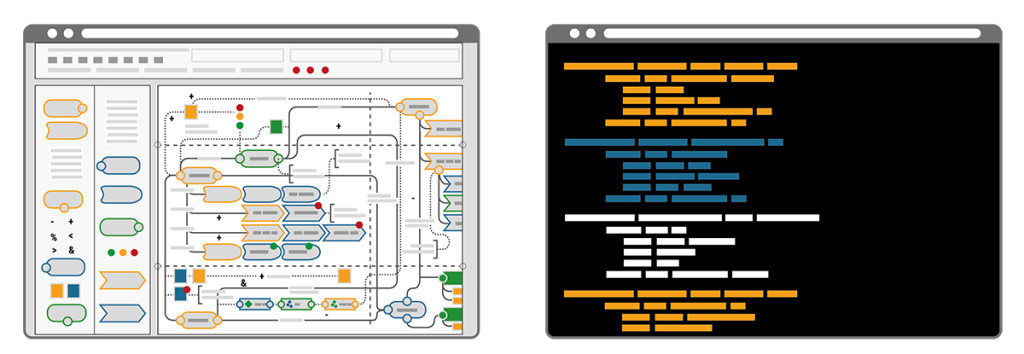
A key difference of the two approaches becomes clear by illustrating the workflow that’s required when changes are needed. Imagine a bike that consists of a number of components, each defined by its name, size, colour, function, etc. Now imagine the colour of the bike needed to be blue instead of yellow. In the IaC approach the single text-based commissioning file can be searched for “colour” and the assigned codes can be auto-replaced in a single step. Alternatively “colour” could be a resource of its own and called upon by all components, thus allowing pre-defined auto-matching colour schemes. Minimal effort, minimal risk of errors and maximum speed to deliver. In contrast, the NC/LC approach would require the administrator to click through every single bike component, select the new colour from a dropdown menu or with a radio button and confirm this selection. Obviously this route takes much longer, is prone to errors and it requires extra knowledge when colour schemes are desired.
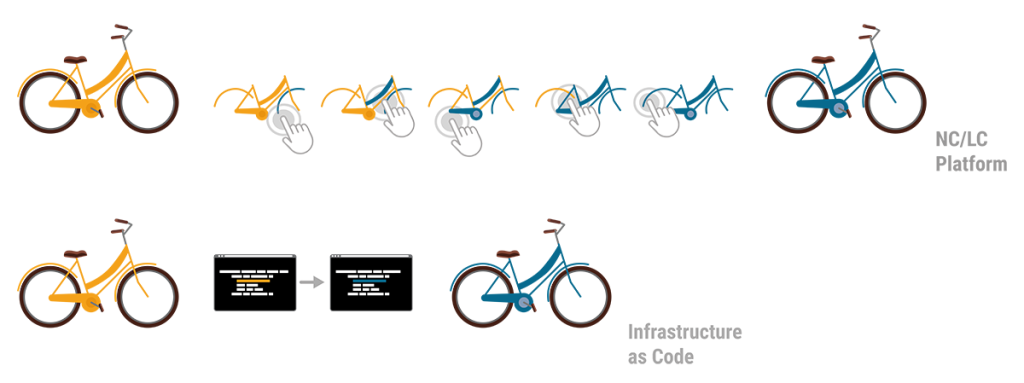
NC/LC appears easier approachable because of its visuality. However, the problem remains in the detail of the configurations that still need to be made.
IaC on the other hand appears very technical as it resembles expert thinking in its structured approach.
Here’s how to make sense of the decision, depending on your context:
When facing a single deployment, NC/LC impresses with its simple and quick handling. The drag-and-drop platform enables a fast implementation without prior knowledge and delivers quick outcomes.
But the ease of integration plays a major role in the IIoT deployment: Unlike other approaches, IaC smoothly integrates into any existing system and pipeline. There is no need to change the current infrastructure, which saves plenty of time and trouble. This also includes the potential of using different services applied on the same infrastructure – non-competitive and simultaneously. IaC also lowers the risk of flaws in processes of adaptation, as it naturally brings versioning. During the development, starting from the very first POC to the finalized environment, all steps stay traceable. Furthermore, staging deployment is easily applicable with IaC to test whether e.g. the system works properly before its final release. Additionally, a safe setup deployment can be integrated.
A crucial advantage of IaC is its limitless scalability. IaC easily adapts to every expansion, enhancement and further development. Practically, new machines or whole heterogenous shop floors are quickly connected. Also, multiple IaC can be deployed and cross-connected, if a diverse handling internally or even externally across factories is required. What makes IaC even more beneficial and suitable for scaling is its capability to design the data output individually. The commissioning files can include instructions on the frequency, format, content and critical threshold values of the data output.
In a limited use-case, NC/LC convinces with a time-saving deployment. It’s highly specialized for the specific use case, which makes it straightforward and user-friendly.
Thanks to its standardized deployment, IaC reduces this risk of errors and false configurations which accompanies continuous improvements. More importantly, IaC enables full automation across multiple manufacturing processes, machines, locations and even different factory operators. Besides, it permits the implementation of specific parameters, if an individual adaptation is desired.
After all, if the need occurs to change the NC/LC infrastructure to a code-based infrastructure, the conversion can become time-consuming: As users are dependent on the pre-programmed underlying code of the interface, the transition might be intransparent and produce some unexpected results. Additionally, the predefined components rule out individual specifications. This choice hampers a factories’ potential for adjustment to market changes and scalability.
Besides the obvious aspect of user-friendliness, the security of an IIoT environment is crucial. IaC scores with a highly secure infrastructure. By using commissioning files, a closed system is created, being naturally intangible for external access. If the latter is desired, pre-defined external access can be permitted explicitly within the code. This way, the privacy protection is ensured and the access stays limited to only intended requests.
NC/LC in contrast, stands out with its user-friendliness. Reduced to a graphical interface and as little code as possible, even non-experts can set the environment up or apply changes immediately if necessary.
What becomes apparent is that the IaC approach is more problem generic. It can be generalized easily to other environments and conditions. NC/LC in contrast, is more problem-specific and suitable for only one precise environment.
To accelerate your decision-making and summarize the main features of both approaches, you can rely on the following rule of thumb:
For more than five years, Cybus has been relying on IaC to deploy an IIoT manufacturing environment. While realizing manifold solutions with diverse customers, our IaC solutions always contribute significantly to scalable, sustainable and efficient IIoT manufacturing environments.
If you have any questions or if you would like to get deeper into the topic of IaC, our experts are happy to provide you with further insights. You are welcome to contact us directly.
Bitkom e.V.: Paulsen, N., & Eylers, K. (2020, May 19). Industrie 4.0 – so digital sind Deutschlands Fabriken. Retrieved July 20, 2020, from
https://www.bitkom.org/sites/default/files/2020-05/200519_bitkomprasentation_industrie40_2020_final.pdf
PAC Deutschland: Vogt, Arnold (2020, April). Das Internet der Dinge im deutschen Mittelstand. Retrieved July 21, 2020, from https://iot.telekom.com/resource/blob/data/183656/e16e24c291368e1f6a75362f7f9d0fc0/das-internet-der-dinge-im-deutschen-mittelstand.pdf
So, we want to compare two very abstract things, a classical Supervisory Control and Data Acquisition (SCADA) system against a modern Industrial Internet of Things (IIoT) system. Let’s structure the comparison by looking at the problems that each system is going to solve or in other words, the benefits that each system is intended to provide to the users.
To further structure the comparison we define the locations where the two systems are acting in:
The Things layer describes the location of the physical equipment the systems are going to interact with. Typically, Things on that level are not directly connected to the Internet, but typically to one or more local networks.
The Gateway describes the location where information from the Things layer is aggregated. It furthermore is the location that defines the transition between the local network(s) and the public Internet.
The Cloud layer is located in the Internet and describes a set of servers that are dealing with the data as provided by one or more Gateways.
The Mobile layer finally describes the location of a human end-user. Irrespective of the geographical location, the user will interact with the data as provided by the Cloud services always having direct access to the Internet.
You already notice that the topic is large and complex. That is why the comparison will be sliced into digestible pieces. Today’s article will start with a focus on Things and how they are represented.
At the lowest level we want to interact with Things, which can be – as the name suggests – quite anything. Fortunately, we are talking about IIoT and SCADA so let’s immediately reduce the scope and look at Things from an industrial perspective.
In an industrial context (especially in SCADA lingo) things are often called Devices, a general name for motors, pumps, grippers, RFID readers, cameras, sensors and so on. In other words, a Device can reflect any piece of (digitized) hardware of any complexity.
For structuring the further discussion let’s divide Devices into two kinds: actors and sensors, with actors being Devices that are „doing something“, and sensors being Devices that are „reading something“.
Having this defined, one could believe that the entire shop-floor (a company’s total set of Devices) can be categorized this way. However, this quickly turns out to be tricky as – depending on the perspective – Devices are complex entities most often including several sensors and actors at the same time.
In its extreme, already a valve is a complex Device composed of typically one actor (valve motion) and two sensors (sensing open and closed position).
The trickiest thing for any software system is to provide interactions with Devices on any abstraction level and perspective. Depending on the user, the definition of what a Device is turns out to be completely different: the PLC programmer may see a single analog output as a Device whereas the control room operator may perceive an entire plant-subsystem as a Device (to formulate an extreme case).
Provide a system that can interact with actors and sensors at the most atomic level but at the same time provide arbitrary logical layers on top of the underlying physical realities. Those logical abstractions must fit the different end-user’s requirements regarding read-out and control and typically vary and overlap in abstraction-level (vertically) as well as in composition-level (horizontally).
We will call the logical representation of a Device a Digital Twin. Digital Twins then form vertices in a tree, with the root vertex expressing the most abstract view of a Device. Lower levels of abstractions are reached by traversing the tree downwards in direction of the leaves each vertex representing a Sub-Device its parent is composed of. The leaves finally represent the lowest level of abstraction and may e.g. reflect a single physical analog input. In SCADA systems such most atomic entities are called Process Variables (PVs). The number of children per parent indicates the horizontal complexity of the respective parent. Finally the shop-floor is represented as a forest of the above described trees indicating a disjoint union of all entities.
In such a solution writing to or reading from a Digital Twin may result in an interaction with a physical or logical property, as Digital Twins may act on each other (as described above) or directly on physical entities.
This poses an (graph-)algorithmic challenge of correctly identifying all Digital Twins affected by a failure or complete loss of connection to a physical property and for the entire access control layer that must give different users different permissions on the available properties.
SCADA systems have a very strong focus on creating logical representations of Devices at a very early stage. A full set of a logical Device hierarchy is established and visualized to the user already on-premise. Most of the data hence never hit the cloud (i.e. the Internet) but is used to immediately feedback into the system or to the operator. Although distributed, SCADA systems aggregate data within (private) local networks and hence have less focus on Internet security or web-standards for communication.
IIoT systems, in contrast, try to make no assumptions on where the representation from raw information to logical Devices is happening. Furthermore, they do not assume that data is used solely for observing and controlling a plant but for completely – yet unknown – use cases, such as integration into other administrative layers of an enterprise. Consequently, communication is prepared to follow most recent standards of security and transport protocols from the beginning on and much effort is undertaken to have a very flexible, albeit semantically clear description of the raw Device data to be consumed by any other higher abstraction layer.
Hopefully, you could already grasp some fundamental differences between the two systems. In the following articles we will sharpen these differences and have a look at further locations of activity (Gateway, Cloud and Mobile).
In a final article we will demonstrate how Cybus Connectware implements all the discussed requirements for a modern IIoT system and how you can use it for your special use-case.
This article will be covering Wireshark including the following topics:
Wireshark is a network packet analyzer. It is used to capture data from a network and display its content. Being an analyzer, Wireshark can only be used to measure data but not manipulate or send it. Wireshark is open source and free which makes it one of the most popular network analyzer available.
Wireshark is available for Linux, Windows and Mac through the official website. For more information about building Wireshark from source please take a look at the official developers guide.
Depending on your operating system and user settings you might have to run Wireshark with admin privileges to capture packets on your network. If your welcome screen is blank and does not show any network interfaces it usually means that your user account is lacking the necessary access rights.
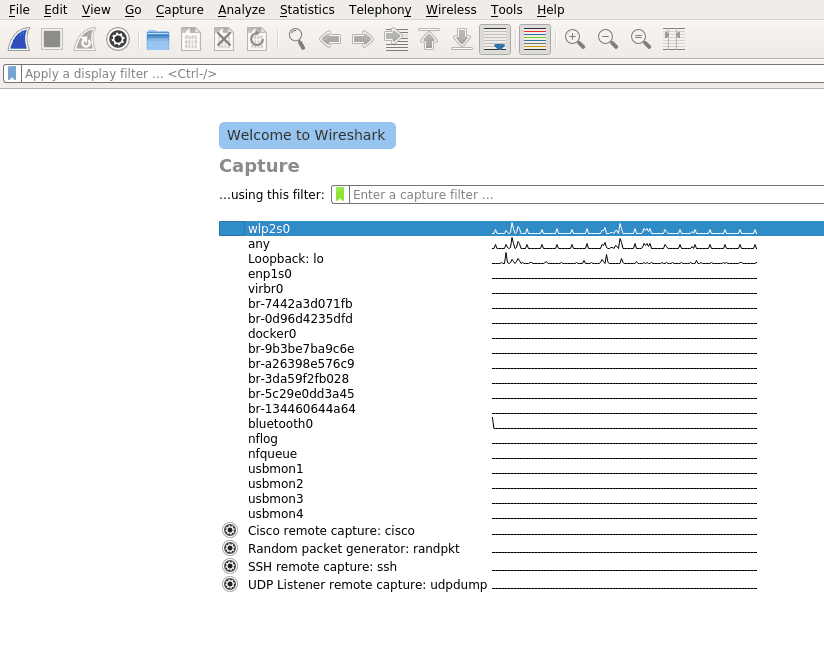
Once Wireshark is started you will be greeted by a welcome screen like the one shown above listing all available network connections. A small traffic preview is shown next to the interface names so it is easy to distinguish between interfaces with or without direct network access. To finally start capturing data on your network you first have to select one or more of these network interfaces by simply clicking on them. To select multiple interfaces at once just hold down ctrl and select all interfaces you want to listen on. Once selected you can start recording packets by clicking the start icon in the top left of the user interface.

The window will change to the main capturing view and immediately display everything passing the network on your selected capturing device as see below.
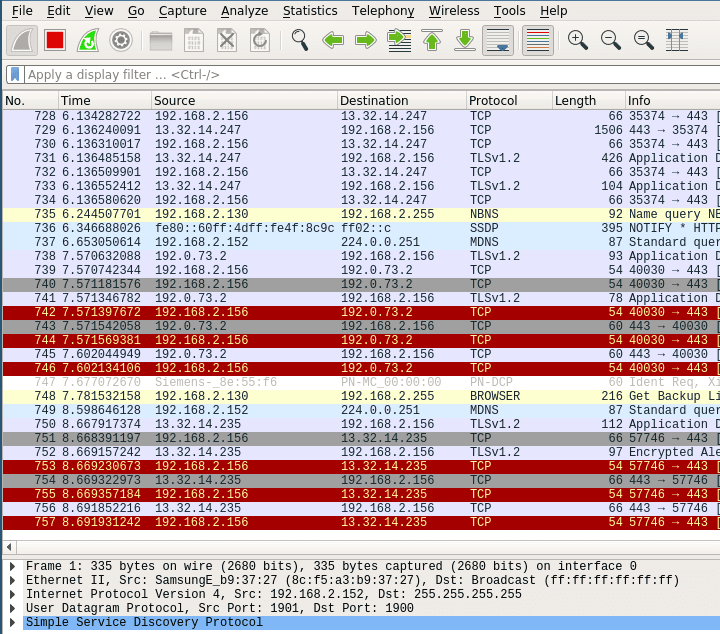
Stop the current capturing process by clicking on the red stop button.

Even the smallest network will produce a lot of static data that can result in very large capture files. To avoid slowdowns you should not capture unfiltered network traffic. To do so open the capture configuration window by clicking on the cogwheel icon.

This will open the capture configuration menu. This menu provides options similar to those you already saw on the welcome screen. You can select network devices, set capture filters and configure the capturing process. This time we want to apply a filter before we start capturing data. Select the network interface of your choice and just type ‚tcp‘ into the capture filter dialog box on the bottom of the configuration window like below.
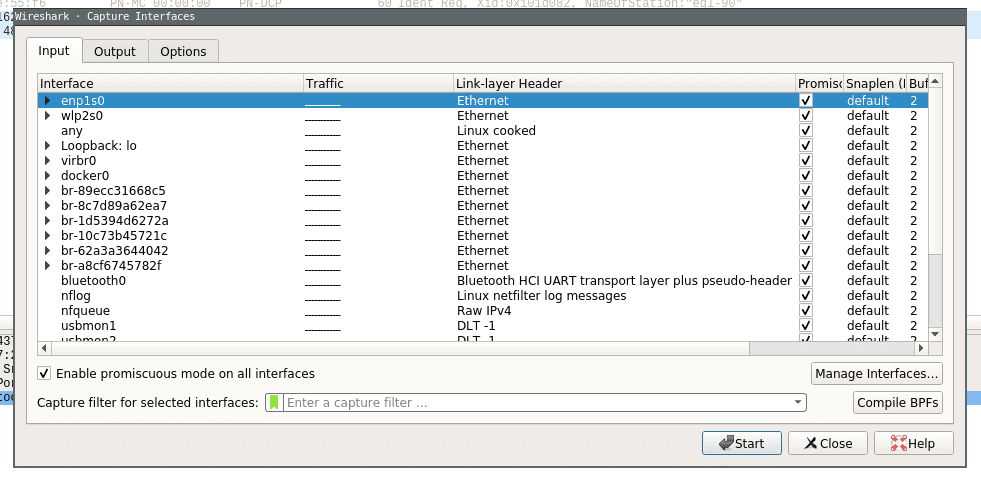
Now when you now start capturing again only packets applicable to the tcp protocol filter are captured and displayed.
Wireshark provides a powerful filter language which not only allows you to narrow down the packets you want to capture but also to sort, follow or even compare their content. This section will only scratch the surface of what is possible with Wireshark so for the time being please consult the Wireshark Wiki for further information about creating filters.
It is a common mistake to believe that capture filters and display filters work the same way in Wireshark. While capture filters change the outcome of the capturing process, display filters can be applied to already running capturing processes to narrow down what to display. Furthermore they use different filter language syntax.
To narrow down our captured data to only include packets from a certain ip range:
src net 192.168.2.0/24Code-Sprache: YAML (yaml)The same can be done to filter the already captured data in the main window:
ip.addr == 192.168.2.0/24Code-Sprache: YAML (yaml)To find exactly what you are looking for on your network you can concatenate different filters. If you want to capture packets from a certain host and port you can simply add both filters together:
host 192.168.2.100 and port 20Code-Sprache: YAML (yaml)You can specify data that you want to explicitly exclude:
host www.google.com and not (port 20 or port 80)Code-Sprache: YAML (yaml)This would only capture data from a certain host which is not transferred on port 20 or 80.
A standard example to see actual network traffic is to ping a host and collect the data.
Just run a capture and set the capture filter to the host you are going to ping (www.google.com would be a popular choice).
host www.google.comGo ahead and start the capturing process. Without any connections to your host open the main window should stay empty for now.
Next open a terminal window and ping the host you specified in the capture filter. Within a few moments you should see the first packets.
Once you have captured some packets press the stop button.
After collecting data the user interface contains three main parts. Those being the packet list pane, the packet details pane and packet bytes pane.
On top is the packet list pane. This view displays a summary of all the captured packets. You can choose any of the packets by just selecting and the other two views will adapt to the selection. Go ahead and select any of the packets and notice how the other two views change.
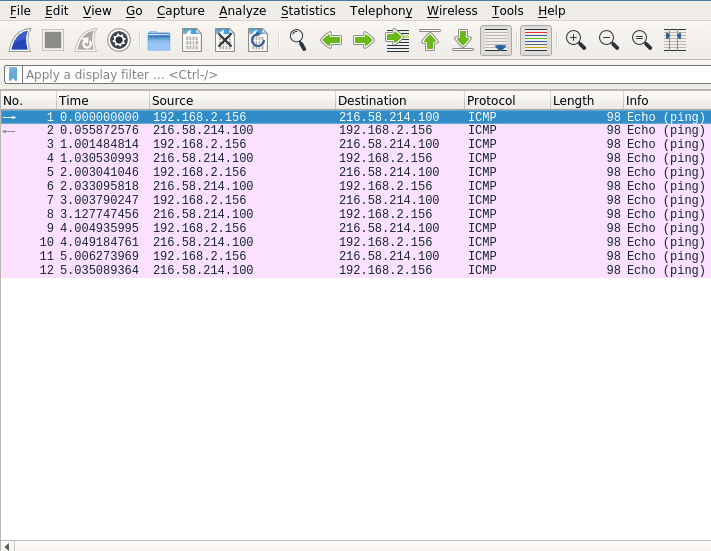
The one in the middle is the packet details pane. It shows more details about the packets you select in the packet list pane.
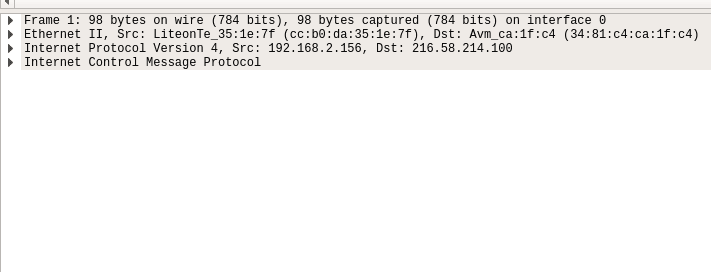
On the bottom the packet bytes pane displays the actual data transferred in the packets.

Using these sections you can view the traffic and break it down for analysis.
Wireshark is a powerful network packet analyzer. It offers everything you need to capture, filter and view your local network traffic. After reading through this article you should have all the basic knowledge necessary to create and filter simple captures.
Sie müssen den Inhalt von reCAPTCHA laden, um das Formular abzuschicken. Bitte beachten Sie, dass dabei Daten mit Drittanbietern ausgetauscht werden.
Mehr InformationenSie sehen gerade einen Platzhalterinhalt von Turnstile. Um auf den eigentlichen Inhalt zuzugreifen, klicken Sie auf die Schaltfläche unten. Bitte beachten Sie, dass dabei Daten an Drittanbieter weitergegeben werden.
Mehr InformationenSie sehen gerade einen Platzhalterinhalt von Facebook. Um auf den eigentlichen Inhalt zuzugreifen, klicken Sie auf die Schaltfläche unten. Bitte beachten Sie, dass dabei Daten an Drittanbieter weitergegeben werden.
Mehr InformationenSie sehen gerade einen Platzhalterinhalt von Instagram. Um auf den eigentlichen Inhalt zuzugreifen, klicken Sie auf die Schaltfläche unten. Bitte beachten Sie, dass dabei Daten an Drittanbieter weitergegeben werden.
Mehr InformationenSie sehen gerade einen Platzhalterinhalt von X. Um auf den eigentlichen Inhalt zuzugreifen, klicken Sie auf die Schaltfläche unten. Bitte beachten Sie, dass dabei Daten an Drittanbieter weitergegeben werden.
Mehr Informationen