Service Basics
Prerequisites
It’s a good idea to make yourself familiar with the following topics before commencing this lesson:
Introduction
This lesson will cover the basic concepts of Cybus Services and how they relate to the Connectware. We will focus on how applications deployed as services can take advantage of the data broker for accessing output from data sources on the Connectware, the management cluster for gaining access to that output and the single entry point for providing new interfaces where users can take advantage of processed data.
What is a Service
While the Connectware gives interfaces for individually performing all actions (like managing users, setting permissions, starting containerized applications, etc.) the idea of services is to bundle all this activities into a single point of configuration and execution. This means that when a service is enabled it will perform a set of operations on the Connectware and when disabled these operations will be removed. Below you will find some examples of possible service use cases.
Preprocessing
Think of a simple machine that produces a metal part. Whether a metal part is being made at any one point of time may not be the important but the average amount being made over a given time period may be useful for knowing if the machine is underperforming. We can accomplish this by connecting the machine to the Connectware, and then deploying a service along side that takes the raw data from the data broker, calculates the average over a given period of time, then uploads the result to the data broker for some other application to consume. This type of application is classified as a preprocessor as it allows us to perform some operation on the data before it is consumed elsewhere.
Device Controller
Think of a machine that drills holes in a piece of material. When the machine is drilling we want to set a lamp to be green, when the machine is between drilling we want to set a lamp to be yellow and when the machine is powered off we want the light to be red. We can connect both the machine and the lamp to the Connectware, then read the status of the machine from the data broker into a service. This service can perform a check on the status and then write out to the data broker on a topic that controls the light to change colors. This type of application is classified as a Device controller as we are using input data to write to a device connected to the Connectware.
Data Visualization
Think of an assembly line that outputs new products ready to be shipped. We can connect the sensors of the assembly to the Connectware and build a service that provides a web dashboard which outputs different graphs for the average output, speed, temperature and power used throughout the day. Administrators can then sign in to the Connectware and view this dashboard to see the status of the assembly line. This type of application is classified as a Data Visualization as it takes data from the Connectware and provides visualizations to allow easier consumption of important data.
And Much More
These are only a few examples of the types of services that Cybus Connectware can deploy. As you will see below the Connectware is built on top of Docker, so as long as your application can be containerized it can be deployed on the Connectware.
How to Create a Basic Service
Services are installed using a commissioning file. Within this text-based YAML file, all so-called resources like connections, endpoints, users, permissions and containerized applications a service uses are listed. Below you will find an example service commissioning file that deploys a Grafana instance which we will configure to show data provided by an OPC UA Server and stored in an InfluxDB. If any section of the service commissioning file needs clarification please feel free to visit the Connectware Docs.
Description & Metadata
The first two sections of the service commissioning file give more general information. In the section description you can give a short description of the service which will also be displayed in the service’s details view on the Connectware Admin User Interface (Admin UI). The section metadata contains the meta information for the service that is being installed. Here we set a name of the service, version number, provide an icon for the thumbnail of the service, specify a provider and a related homepage.
#------------------------------------------------------------------------------
# CYBUS SERVICE COMMISSIONING
#------------------------------------------------------------------------------

description: |
  Service Commissioning File Example
  Cybus Learn - Service Basics
  https://learn.cybus.io/lessons/service-basics/

metadata:
  name: Service Basics Example
  version: 0.0.3
  icon: https://www.cybus.io/wp-content/uploads/2019/03/Cybus-logo-Claim-lang.svg
  provider: Cybus GmbH
  homepage: https://www.cybus.io
Code-Sprache: YAML (yaml)
Parameters
To make a service configurable, we can specify parameters. Parameters are like referable variables whose values are defined by the user every time a service is to be installed or reconfigured. When applying a commissioning file in the Connectware, the user is asked to enter custom values for the parameters or to confirm the default values.
In this example we use parameters to make the OPC UA server address configurable for the case it would move to another location.
#------------------------------------------------------------------------------
# Parameters
#------------------------------------------------------------------------------
parameters:

  opcuaHost:
    type: string
    description: OPC UA Host Address
    default: opcuaserver.com

  opcuaPort:
    type: integer
    description: OPC UA Host Port
    default: 48010
Code-Sprache: YAML (yaml)
Resources
In the Resources section we declare every resource that is needed for our service. All resources like connections, endpoints, users, permissions and containerized applications are configured here. The first resource we define for our service is the connection to the OPC UA server.
#------------------------------------------------------------------------------
# Resources
#------------------------------------------------------------------------------

resources:
Code-Sprache: YAML (yaml)
Connections & Endpoints
In this lesson we will collect some simulated data from a public OPC UA server. We define a connection and endpoint resources for this. For the connection we just need to specify the protocol as well as the server’s host address and port, which we define by referencing the previously declared parameters. For the endpoints we define three resources, each subscribing to a variable node on the OPC UA server identified through the nodeId, which will be our data sources.
  #----------------------------------------------------------------------------
  # OPC UA Connection
  #----------------------------------------------------------------------------

  opcuaConnection:
    type: Cybus::Connection
    properties:
      protocol: Opcua
      connection:
        host: !ref opcuaHost
        port: !ref opcuaPort
        #username: myUsername
        #password: myPassword

  Humidity:
    type: Cybus::Endpoint
    properties:
      protocol: Opcua
      connection: !ref opcuaConnection
      subscribe:
        nodeId: ns=3;s=AirConditioner_1.Humidity

  PowerConsumption:
    type: Cybus::Endpoint
    properties:
      protocol: Opcua
      connection: !ref opcuaConnection
      subscribe:
        nodeId: ns=3;s=AirConditioner_1.PowerConsumption

  Temperature:
    type: Cybus::Endpoint
    properties:
      protocol: Opcua
      connection: !ref opcuaConnection
      subscribe:
        nodeId: ns=3;s=AirConditioner_1.Temperature
Code-Sprache: YAML (yaml)
We define another connection for storing the collected data in an InfluxDB. The InfluxDB will be set up later in this lesson but we already know that it will be running within the Connectware as a containerized application. For the specific case of accessing a containerized application within the Connectware, the host has to be defined as connectware. The InfluxDB will be available on port 8086 of that container. The name of the InfluxDB bucket to store information is not really important in this use case and will be set to generic. The transport scheme will be set to http.
We also define an endpoint for the InfluxDB connection which will carry out queries to write data to the InfluxDB. Which data will actually be written to the database will be defined in the next step.
#----------------------------------------------------------------------------
# InfluxDB Connection
#----------------------------------------------------------------------------
 influxdbConnection:
   type: Cybus::Connection
   properties:
     protocol: Influxdb
     connection:
       host: connectware
       port: 8086
       bucket: generic
       scheme: http

 airconditionerWrite:
   type: Cybus::Endpoint
   properties:
     protocol: Influxdb
     connection: !ref influxdbConnection
     write:
       measurement: airconditioner
Code-Sprache: YAML (yaml)
To learn more about the details of defining connections and endpoints utilizing various protocols, explore other lessons on Cybus Learn. To learn more about the setup of an OPC UA connection and endpoints, have a look at the article How to Connect to an OPC UA Server. For details of further protocols you can also consult the Protocol Details in our Docs.
Mappings
The data collected by our OPC UA endpoints should be available to our service on the MQTT data interface provided by the Connectware MQTT Broker. So we create a mapping from the OPC UA endpoints to the desired MQTT topics. The mqttMapping subscribes to the endpoints we created previously and which we refer to by name utilizing the !ref operator followed by the resource’s name. The mapping then publishes the data to the specified topic.
 #----------------------------------------------------------------------------
 # MAPPINGS
 #----------------------------------------------------------------------------

  mqttMapping:
    type: Cybus::Mapping
    properties:
      mappings:
        - subscribe:
            endpoint: !ref Humidity
          publish:
            topic: 'building-automation/airconditioner/1/humidity'
        - subscribe:
            endpoint: !ref PowerConsumption
          publish:
            topic: 'building-automation/airconditioner/1/power-consumption'
        - subscribe:
            endpoint: !ref Temperature
          publish:
            topic: 'building-automation/airconditioner/1/temperature'
Code-Sprache: YAML (yaml)
We create another mapping resource which will be responsible for mapping data from the MQTT topics to the endpoint airconditionerWrite, again referenced with the !ref operator. We will additionally do some data pre-processing in this mapping to get the information about the datas origin to the database and for that we utilize a so-called rule. This rule is based on a JSONata expression which will add the name of the last subtopic to the message’s JSON string under the key “measurement”. The value of this key will overwrite the default measurement name we defined in the endpoint definition when sent to InfluxDB. It is determined by the + operator in the subscribe-topic definition that acts as a wildcard while deriving a context variable named measurement.
  influxdbMapping:
    type: Cybus::Mapping
    properties:
      mappings:
       - subscribe:
           topic: 'building-automation/airconditioner/1/+measurement'
         publish:
           endpoint: !ref airconditionerWrite
         rules:
           - transform:
               expression: '$merge([$,{"measurement": $context.vars.measurement}])'
Code-Sprache: YAML (yaml)
For more information on the creation of mappings again take a look at the lesson How to connect to an OPC UA server.
Volumes
A volume is a resource that represents a storage space and can be associated with containers. We want to utilize two containers, which will need additional storage space, so we create a volume for each of them.
  #----------------------------------------------------------------------------
  # VOLUMES
  #----------------------------------------------------------------------------

  grafanaVolume:
    type: Cybus::Volume

  influxdbVolume:
    type: Cybus::Volume
Code-Sprache: YAML (yaml)
Ingress Routes
The service containers running within the Connectware architecture are not directly exposed and are running separate from the Connectware core containers for security reasons. To make them accessible from the outside as well as from within Connectware we have to define an ingress route for each of them.
Ingress routes allow services to provide web dashboards and REST APIs which can then be accessed through the HTTPS interface of the Cybus Connectware. In this case we define an HTTP interface and point it to port 3000 on the Grafana container which will allow us to access the dashboards.
#----------------------------------------------------------------------------
# INGRESS ROUTES
#----------------------------------------------------------------------------

  # Grafana
  grafanaURL:
    type: Cybus::IngressRoute
    properties:
      container: !ref genericGrafana
      type: http
      slug: grafana
      target:
        path: '/'
        port: 3000
Code-Sprache: YAML (yaml)
Ingress routes also allow communication between the Connectware core containers and custom containers utilized by services. For the InfluxDB container we define a tcp route between the container port 8086, on which the InfluxDB is available, and the Connectware port 8086, which we defined our InfluxDB connection to connect to.
 # InfluxDB
 influxdbRoute:
   type: Cybus::IngressRoute
   properties:
     container: !ref influxdb
     type: tcp
     containerPort: 8086
     connectwarePort: 8086
Code-Sprache: YAML (yaml)
To learn more details about ingress route resources take a look at the Connectware Docs.
Frontends
For accessing the dashboard on the frontend, we define a link to the Grafana ingress route, which will simply provide a button named Dashboard on our service details view in the Connectware Admin UI.
#----------------------------------------------------------------------------
# FRONTENDS
#----------------------------------------------------------------------------

  dashboard:
    type: Cybus::Link
    properties:
      name: Dashboard
      ingressRoute: !ref grafanaURL
      href: ''
Code-Sprache: YAML (yaml)
Containers
The containers section comprises the Docker Containers the service will run. These containers can either come from the Official Docker Registry or from the Cybus Registry. That means any application that is deployed on Connectware can take full advantage of all the containerized software on Docker Hub and your custom containerized software delivered securely through the Cybus Registry. In the example below we pull the official InfluxDB image from Docker Hub and a pre-configured version of Grafana from the Cybus registry. Several options that can be used when configuring these containers can be found in the Connectware Docs. For the container-specific environmental variables defined under the property environment, you should consult the container’s documentation.
  #----------------------------------------------------------------------------
  # CONTAINERS
  #----------------------------------------------------------------------------

  influxdb:
    type: Cybus::Container
    properties:
      image: image: registry.hub.docker.com/library/influxdb:1.8-alpine
      volumes:
        - !sub '${influxdbVolume}:/var/lib/influxdb'
      environment:
        INFLUXDB_DB: generic
        INFLUXDB_HTTP_FLUX_ENABLED: true

  genericGrafana:
    type: Cybus::Container
    properties:
      image: registry.cybus.io/cybus-services/generic-grafana:1.3.0
      volumes:
        - !sub '${grafanaVolume}:/var/lib/grafana'
      environment:
        GF_SERVER_ROOT_URL: !sub '/services/${Cybus::ServiceId}/grafana'
        GF_AUTH_ANONYMOUS_ENABLED: true
        INFLUX_HOST: !ref influxdb
        INFLUX_PORT: 8086
        INFLUX_DB: generic
Code-Sprache: YAML (yaml)
How to Install a Service
Now that we know what a service is and we have configured our own example we can install it on the Connectware. The service commissioning file can be found on GitHub.
Install Service
- On the navigation panel, click Services.
- Click Upload Service.

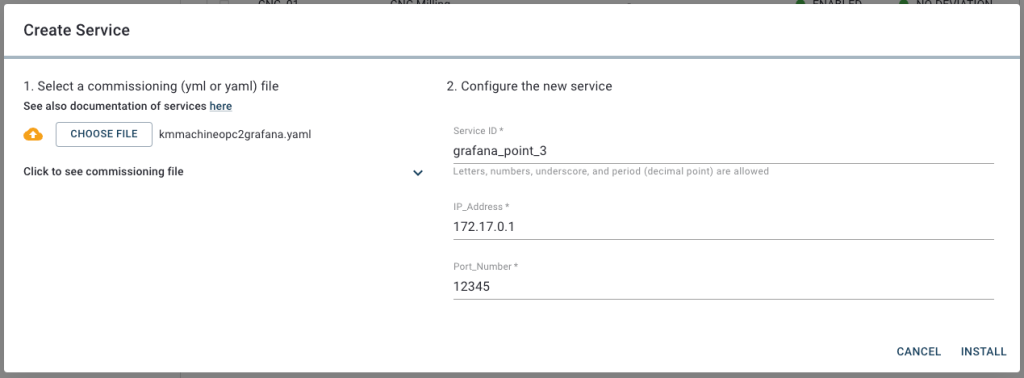
- In the Create Service dialog, click Choose File, select a commissioning file from your local computer in the file browser, and click Ok.
- Select the
service-example-commissioning-file.ymlon your computer and click Install to confirm the default values and start the installation.
- Click the service to open the Service Details view.
- Click Enable.

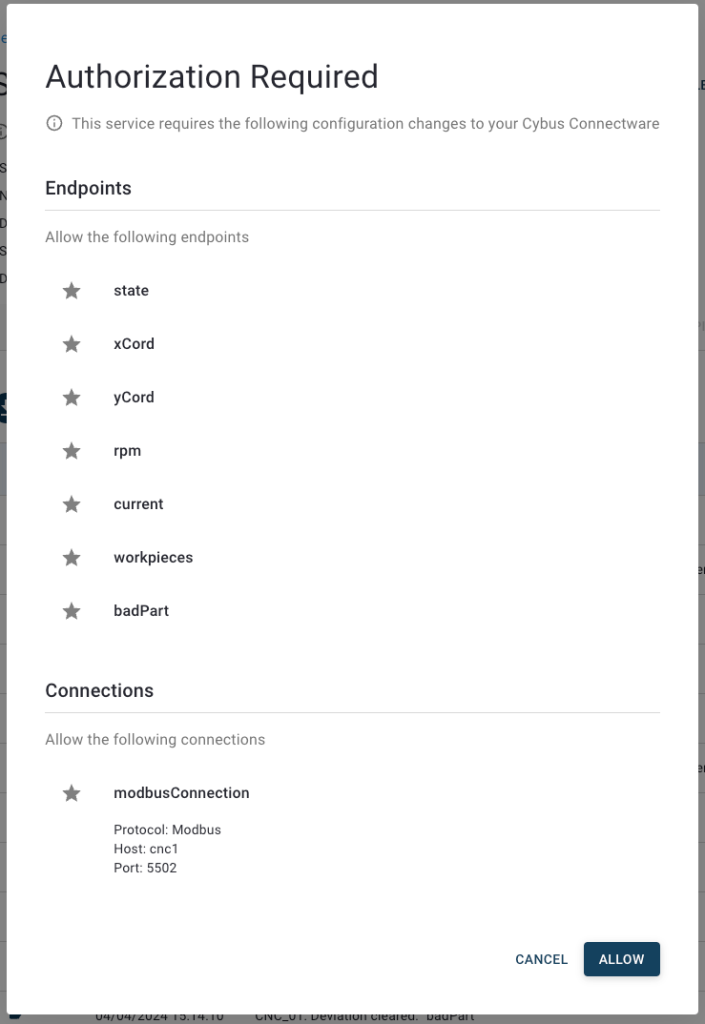
- This will open the Authorization Required dialog which provides a short summary of all the resources that your service needs to access in order to fully function. Make sure to review the requirements thoroughly. Once you are done, enable the service by clicking Allow in the bottom right corner of the Authorization Required dialog.
Explore Service
Now that you have successfully installed and enabled a service we can use the provided dashboard and configure Grafana to visualize our simulation data.
- Click the Dashboard button on the service detail view.

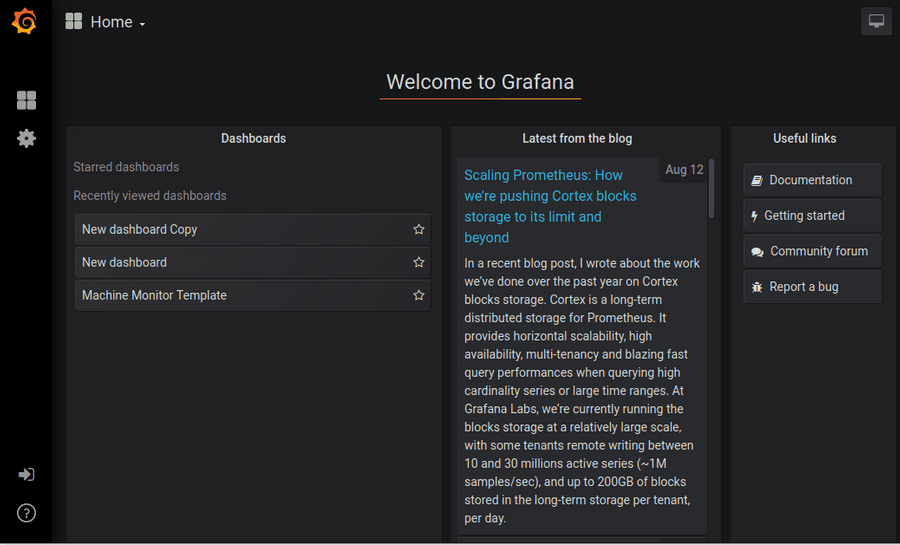
- The welcome screen of Grafana has now opened in a new tab. Initially you need to log in to modify any dashboards. Click the Sign In button in the bottom left corner and log in with the default Grafana credentials username: admin and password: admin.
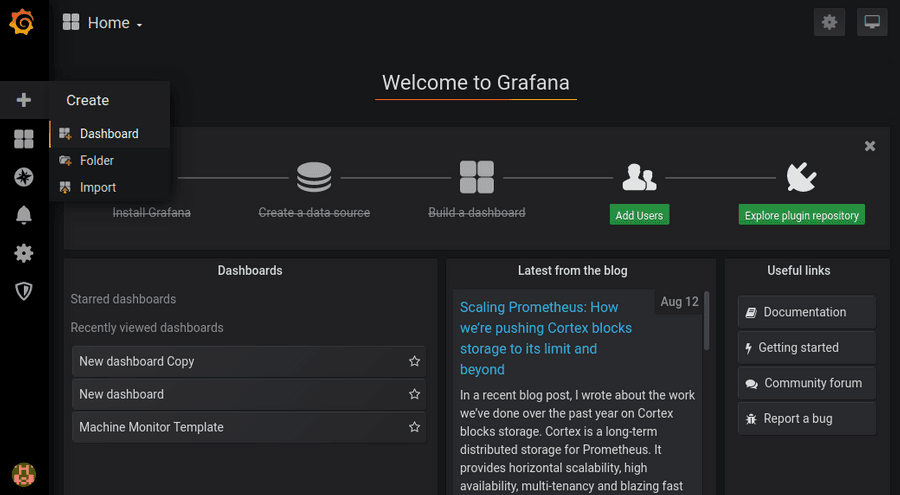
- As soon as you are logged in and back to the welcome screen go to the side menu and create a new dashboard.
- Choose Add Query from the new panel.
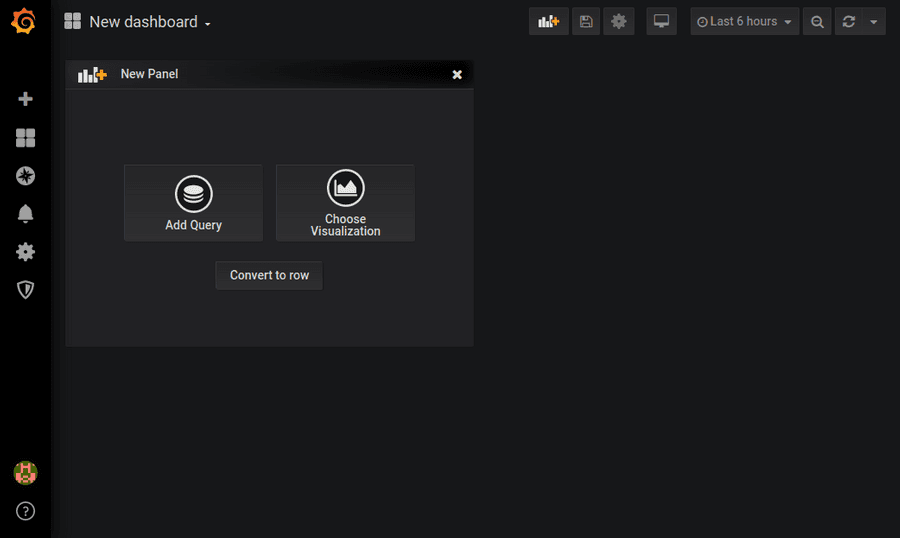
- Through service commissioning our InfluxDB is already connected to Grafana and selected as default database. Click on select measurement and a list will present the data to you that we mapped on the MQTT topics.
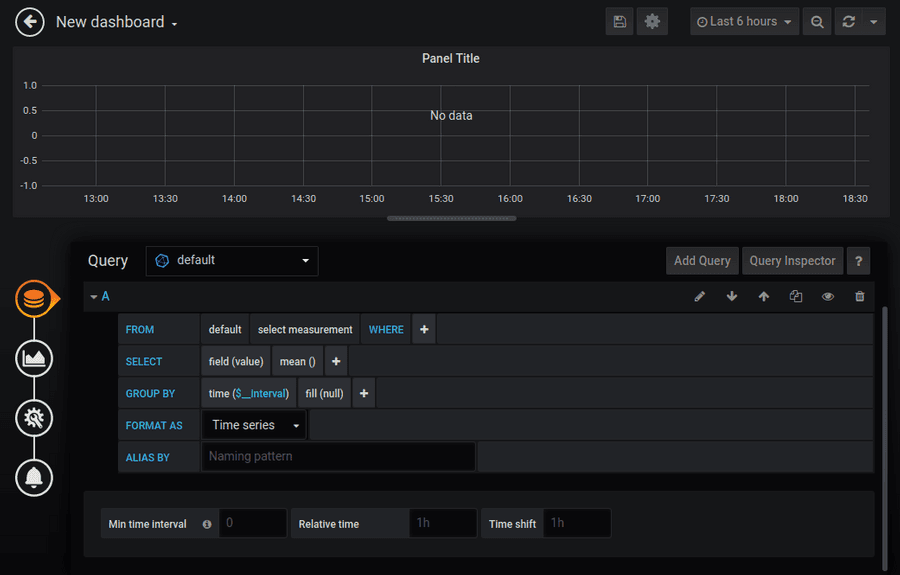
- With the four circles on the left side you can switch between different setting categories and for example edit the name of the panel.
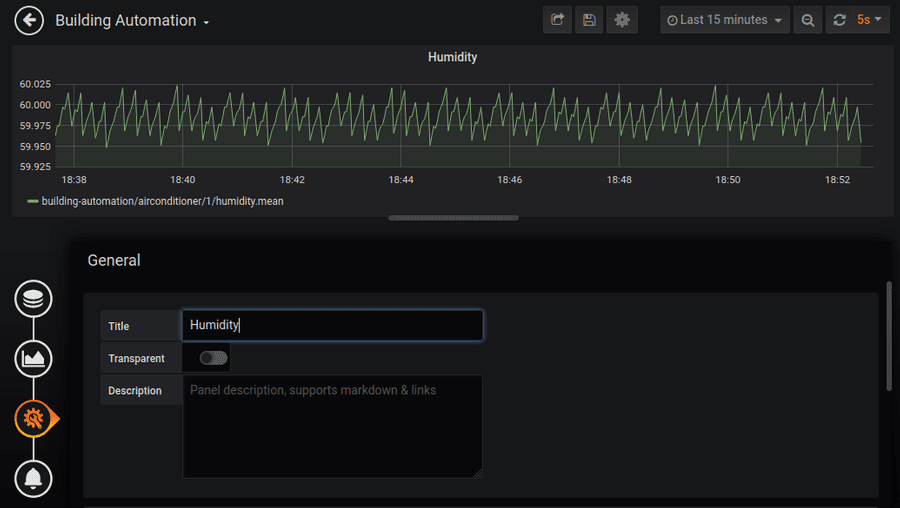
- In the upper right corner you can choose the time range and refresh rate. Next to this click the Save dashboard button, choose a name for the dashboard and click Save.
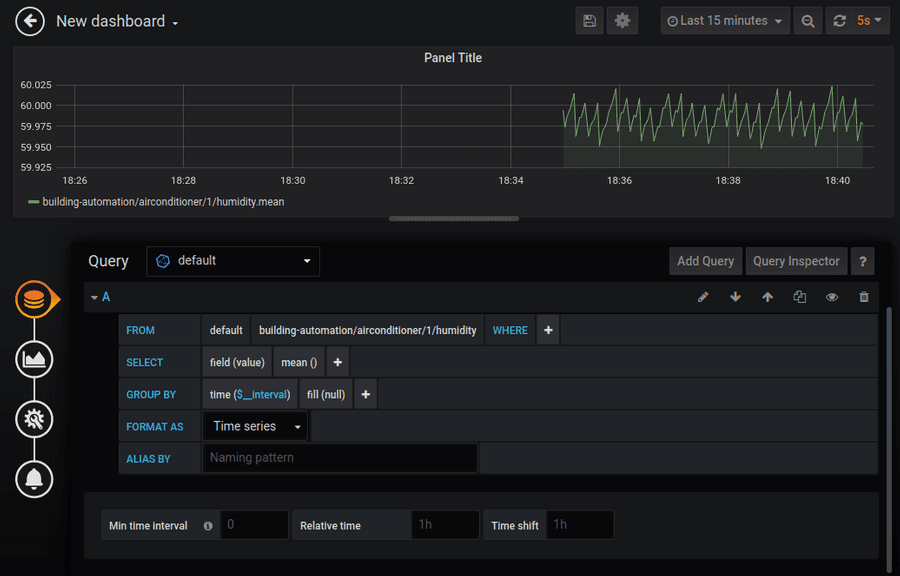
- Clicking the highlighted Add panel button you can extend your dashboard with more panels like that.
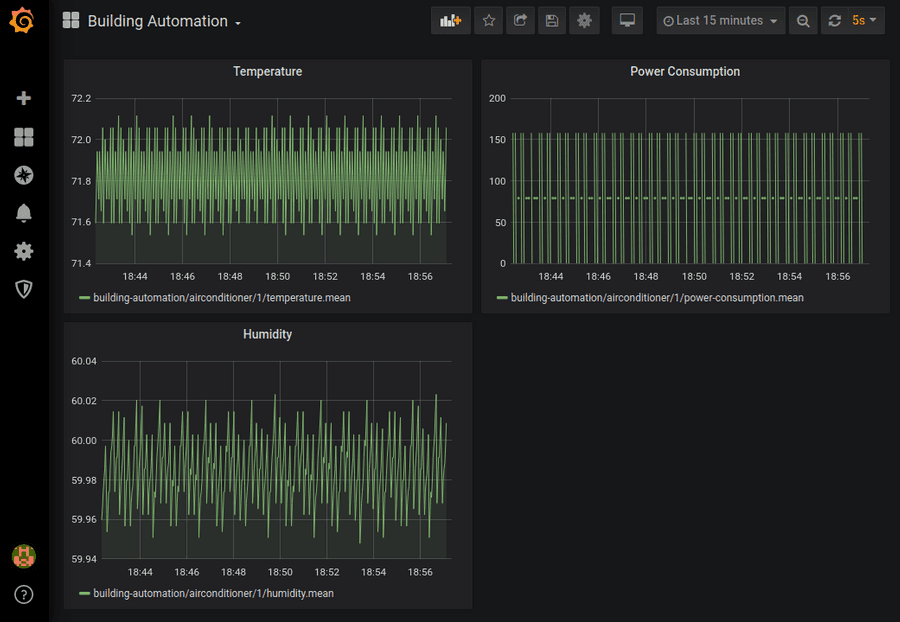
The query editor for Grafana is incredibly powerful and can do much more then we will show in this tutorial. For more details read the documentation here.
Summary
In this lesson we learned what services are and made a basic Grafana service whose configuration gave a short demonstration of the various resources a service can utilize and how they are configured to create a consistent context of cooperation. We then configured Grafana to visualize humidity data from our simulation OPC UA server.
This article should have given you an overview over the possibilities that services offer in terms of interconnectivity. Knowing the methods of utilizing containers, including data sources, organizing their data flow and managing their access permissions should give you a hint of how you can structure the first own commissioning file for your Connectware!
Going Further
Learn more about Cybus Connectware in our Connectware Docs or explore more lessons here on Cybus Learn. If you would like to know how to include user management in your service, take a look at the lesson on User Management. You can also find more information about using the Grafana service in the Grafana Documentation.
Need more help?
Can’t find the answer you’re looking for?
Don’t worry, we’re here to help.
